Exploding Topics
Remineralizing Gum search volume grew from under 100 to 27,100 monthly searches between February 2024 and January 2026.
Remineralizing gum
+5100%
GLP 1 Supplement search volume grew from 5,920 to 74,000 monthly searches between February 2024 and January 2026.
GLP 1 supplement
+1150%
Soursop Bitters search volume grew from 9,900 to 110,000 monthly searches between March 2024 and February 2026.
Soursop bitters
+1011%



Get Advanced Insights on Any Topic
Discover Trends 12+ Months Before Everyone Else
How We Find Trends Before They Take Off
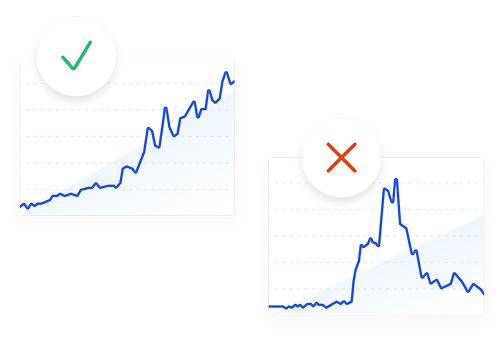
Exploding Topics’ advanced algorithm monitors millions of unstructured data points to spot trends early on.
Keyword Research
Performance Tracking
Competitor Intelligence
Fix Your Site’s SEO Issues in 30 Seconds
Find technical issues blocking search visibility. Get prioritized, actionable fixes in seconds.
Powered by data from
Latest Blog Posts
Featured Case Studies
See what's trending before everyone else
Each week, we'll send you our best Exploding Topics. Plus, expert insight and analysis.
Exploding Topics vs Treendly: My Choice for 2026

 Add Exploding Topics on GoogleAdd Exploding Topics as your preferred source to see more of our stories on Google.
Both Exploding Topics and Treendly have the same core functionality: detecting emerging trends and tracking their growth over the long term.
Yet there are considerable differences in how they report trends and the level of insights you can gather for your business, marketing, and product strategy.
I tested both tools extensively over a week.
Here are my honest thoughts about how Exploding Topics compares with Treendly.
Trends Database
My verdict: Exploding Topics offers a far larger trend database (1.5M+), deeper filtering (15-year history, volatility, growth patterns), clearer search-volume metrics, forecasting, key indicators, channel breakdowns, and strong related trends.
Treendly is smaller (12k+ trends) but adds country filtering, and Amazon/YouTube related searches, though influencer and forum features feel less reliable.
Exploding Topics
Exploding Topics has a massive library of 1.5M+ unique trends in its database. And new trends are regularly added to the database.
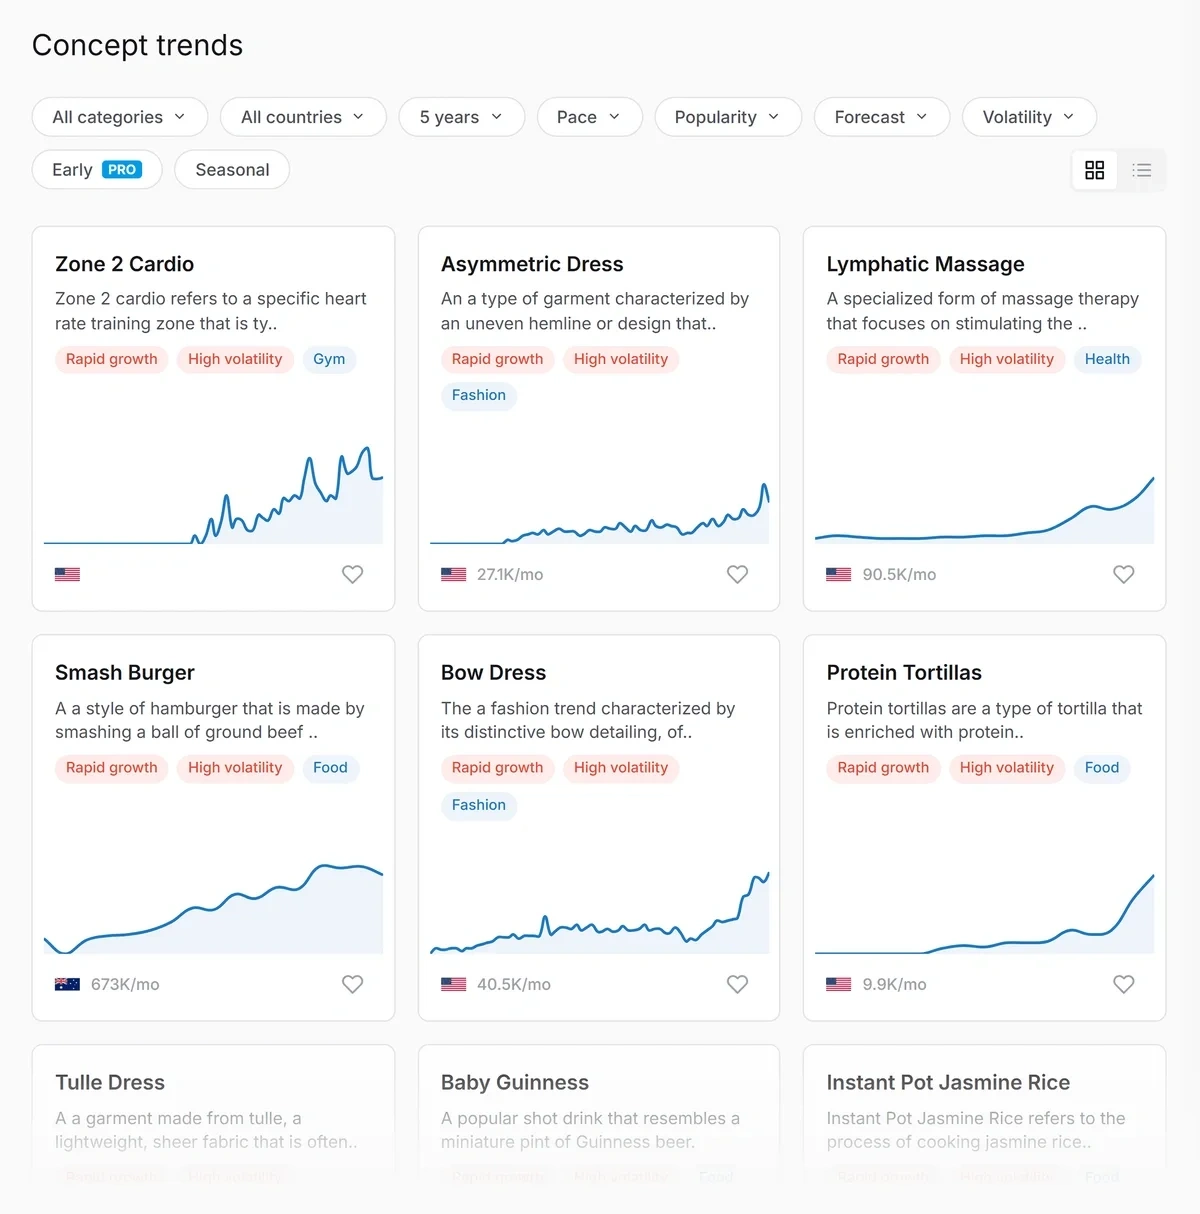
The app tracks trends across 11 broad categories. Each category has multiple sub-categories, so you can focus on specific niches with greater precision.
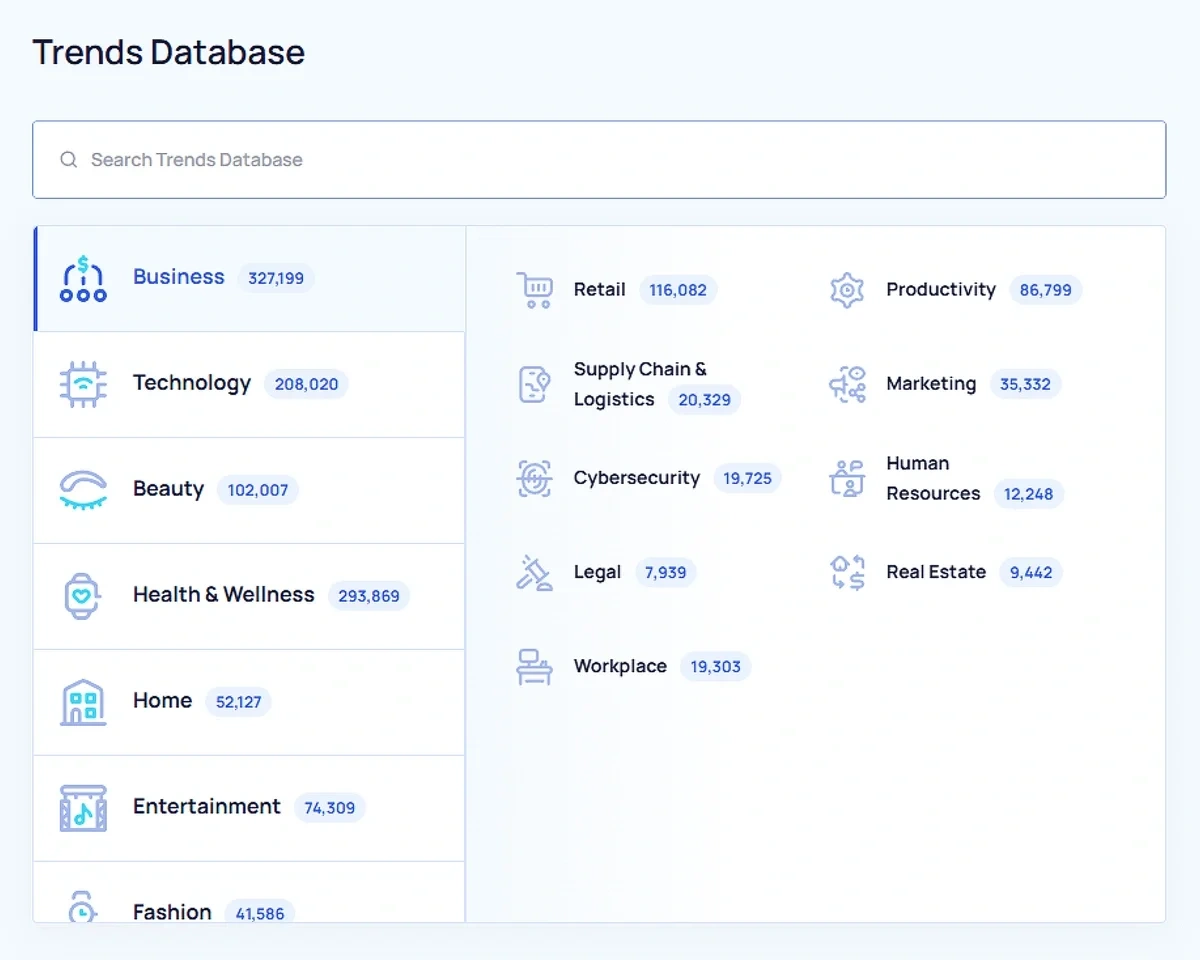
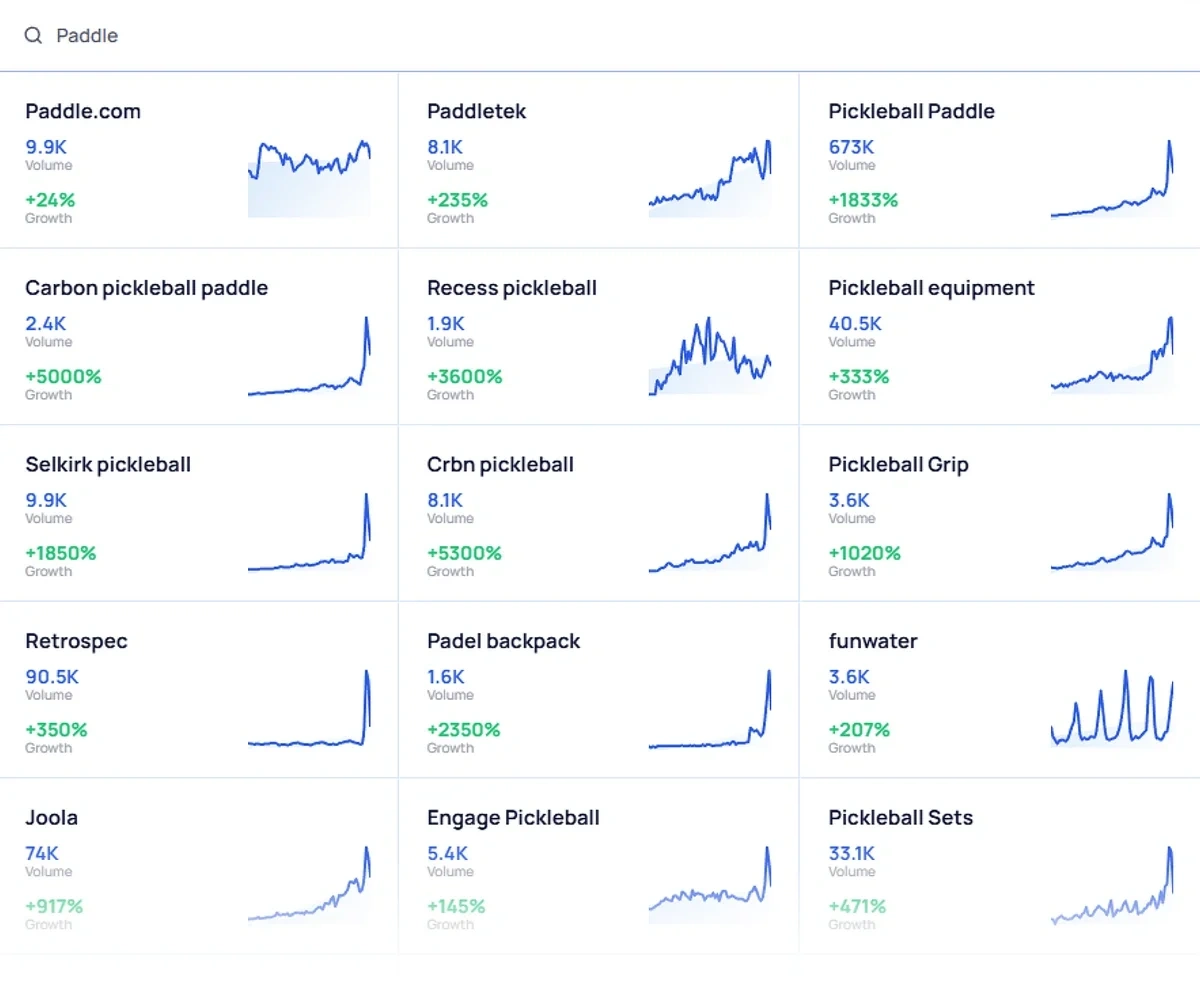
As you click through a category, you’ll find a list of topics displayed with trend chart, search volume, and growth percentage, as well as a brief description.
The simplicity of these metrics makes analysis at a glance straightforward.
By default, the trends are listed with the fastest-growing ones first.
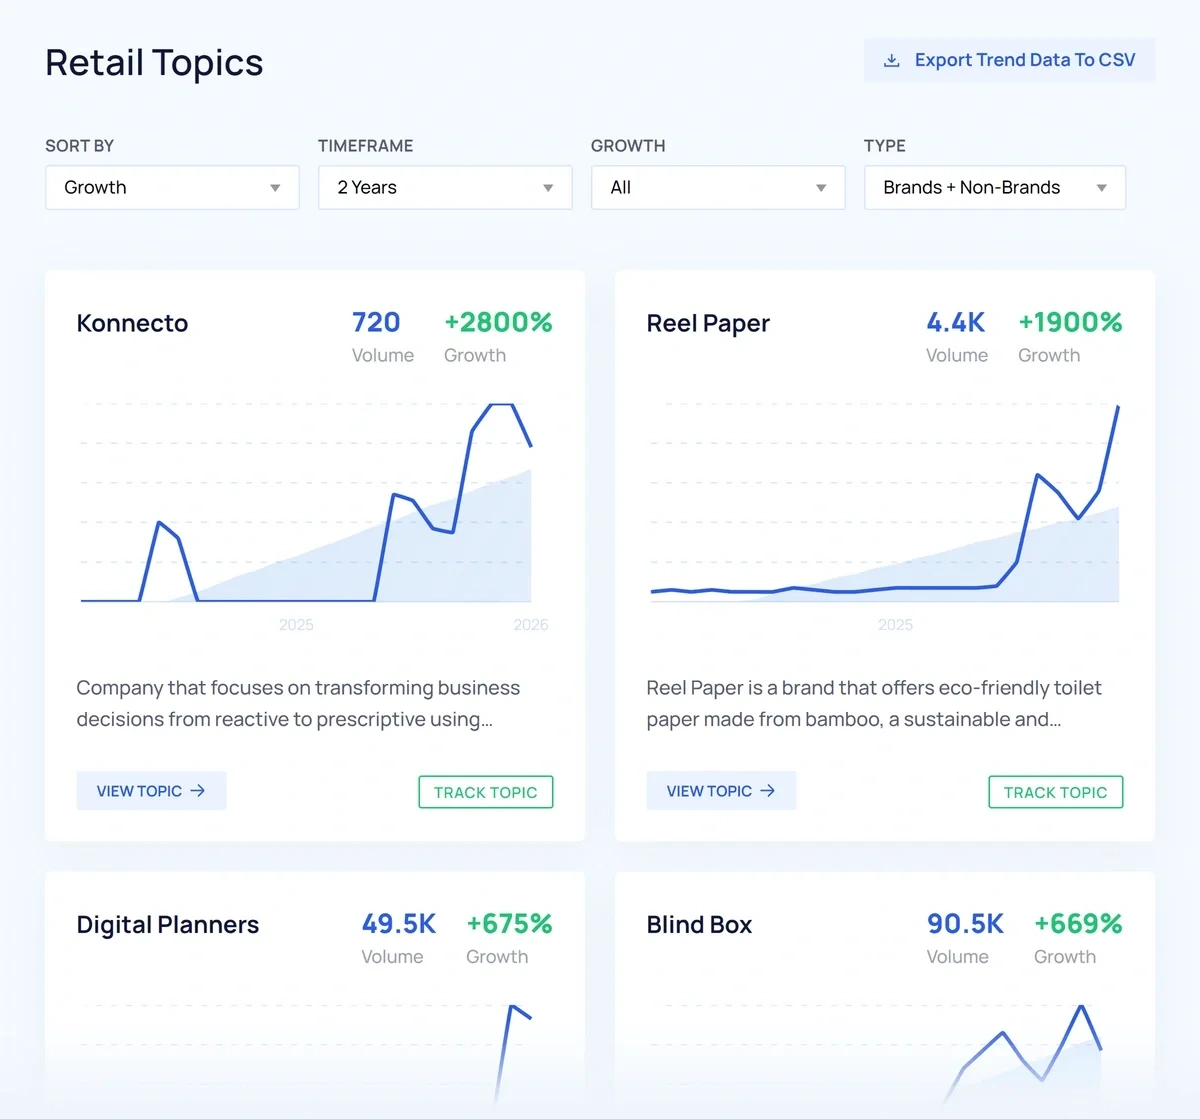
But you get a lot of flexibility to dial in just the right set of filters and narrow down to trends that you’re really after.
Trend Filters
Are you interested in trends that have taken the biggest leaps in growth percentage in the measured timeframe? Or is it the average trend growth you’re focusing on?
You can sort the trends by relative growth % or the best-fit trend line, depending on what you’re after.
That’s not all.
Exploding Topics lets you sort trends by latest discovery date and search volume as well.
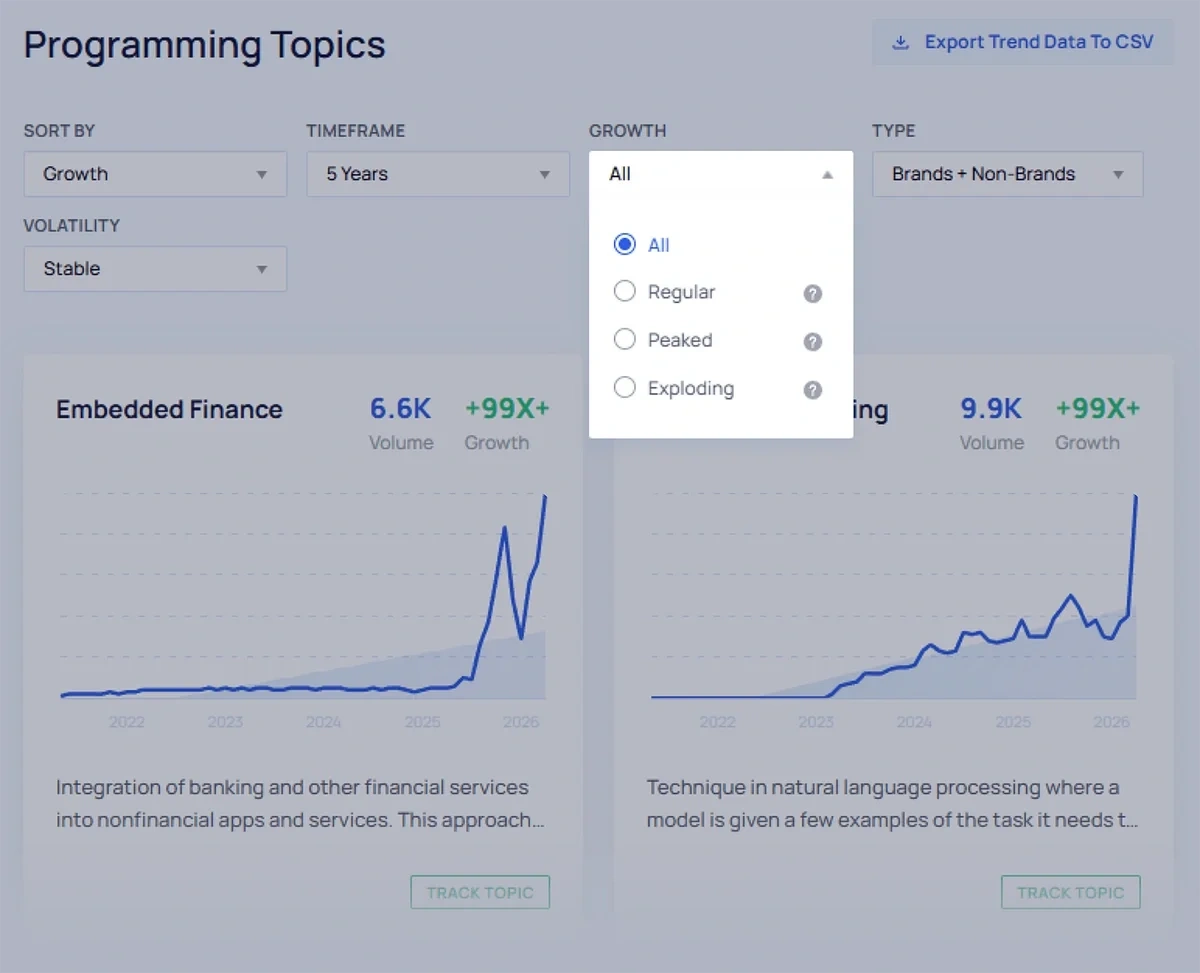
You can get super specific with the timeframe of your trend analysis.
Extend the time series chart as far back as 15 years or as early as the past 3 months.
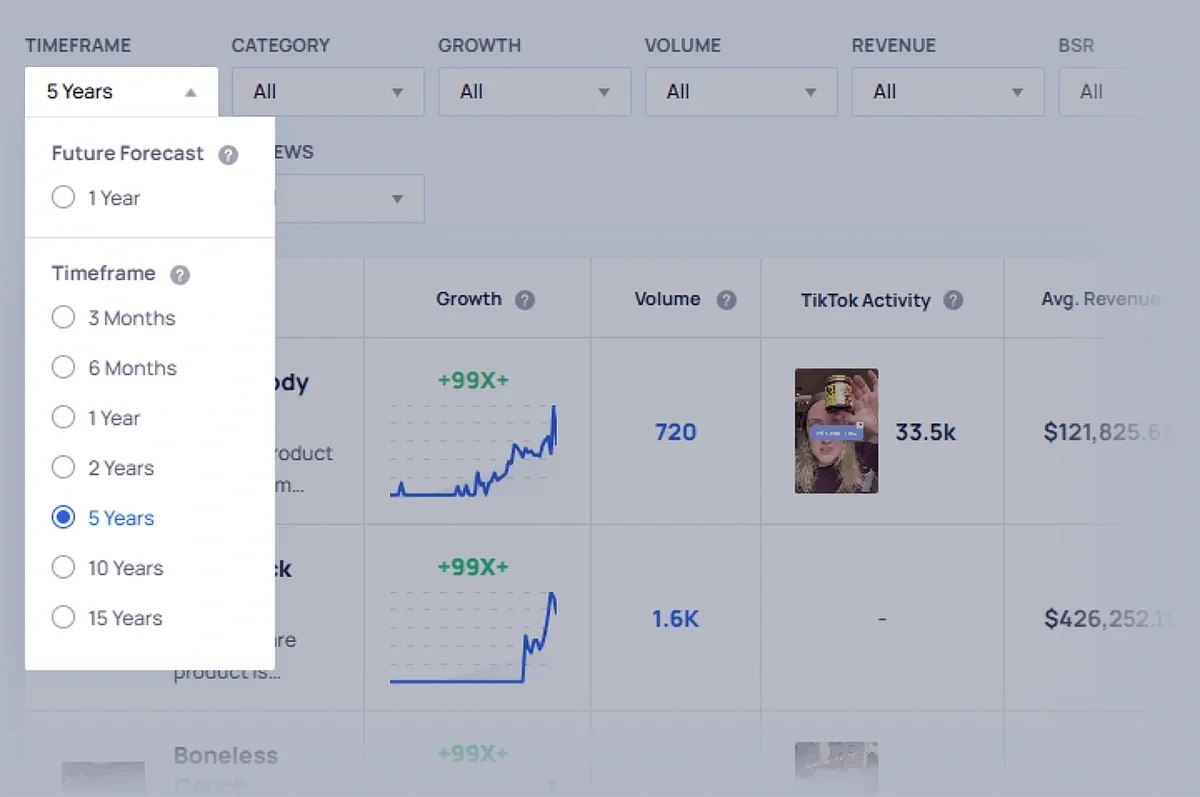
The growth filter is another incredibly handy feature. The Exploding Topics trend detection algorithm characterizes trends by three kinds of growth patterns:
- Regular
- Peaked
- Exploding
These filters are perfect for finding trends that are in a specific phase of their growth.
For most businesses, the trends that really matter are the ones that stick.
I find the volatility filter particularly useful for this reason. You can set it to “stable” to search for charts that are showing consistent growth and search volume.
You can look for volatile graphs instead as well if your strategy is more focused on short-term wins for your content or product sales.
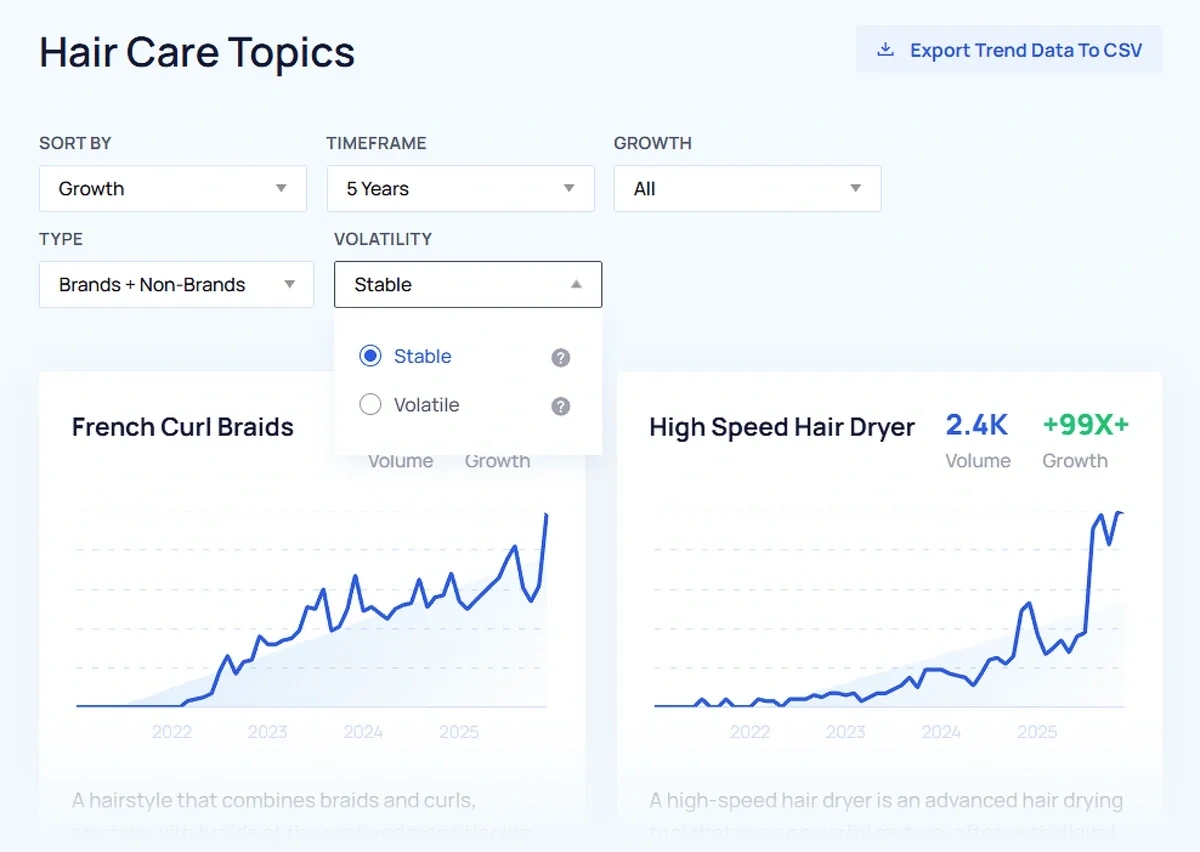
Using all these filters together allows you to really narrow down to charts that meet your criteria.
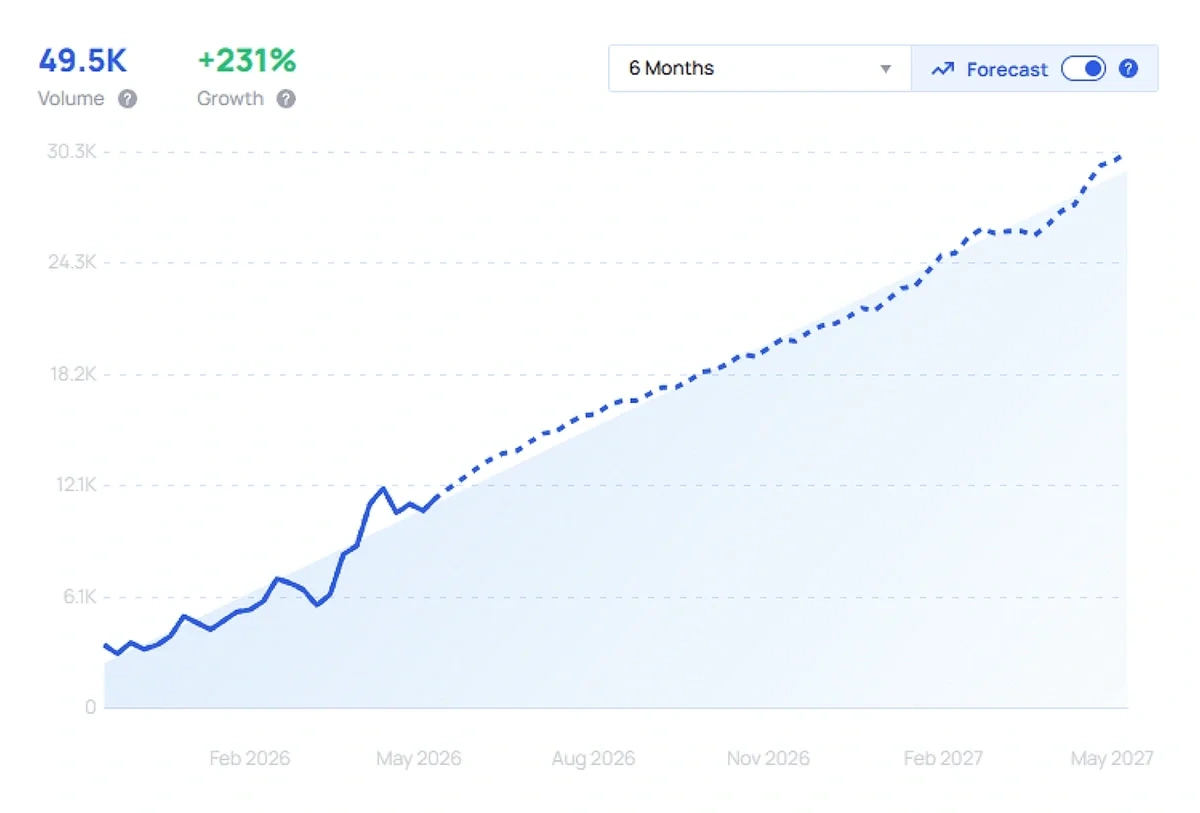
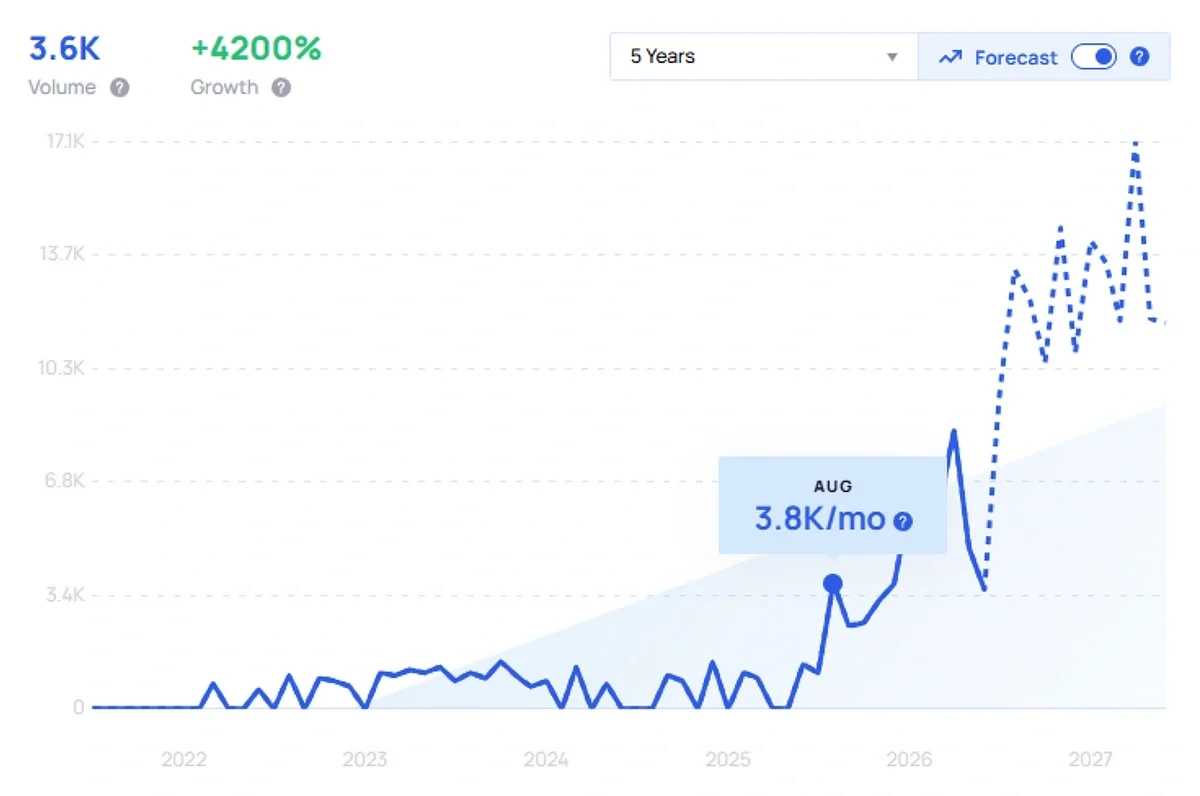
You can click through a trend to zoom into the chart and interactively change its timeframe.
The forecast toggle is also very helpful when you want to predict how strongly a trend is likely to grow over the next 12 months.
Crucially, Exploding Topics gives you additional insights under the trend chart.
When looking at trends, the ”Key Indicators” give you everything you need to know about a trend’s current behavior and its forecast.
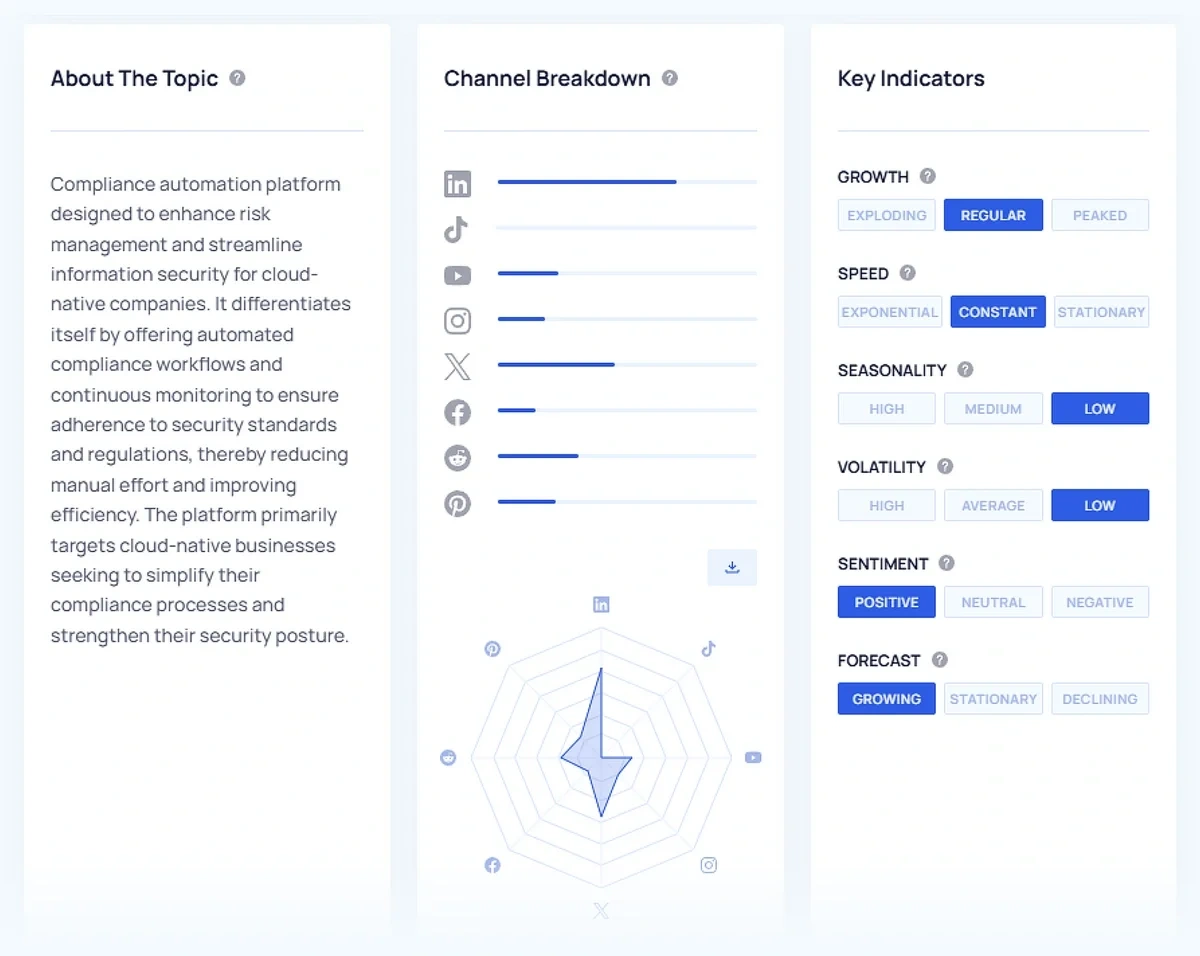
At a glance, these indicators tell you whether a trend:
- Is growing exponentially
- Has seasonal fluctuations throughout the year
- Exhibits volatility in search volume growth
- Is perceived positively by consumers
- Will continue growing, hold steady, or start to decline
In my experience, most trend analysis tools don’t give you this level of detail about any topic.
Additionally, it displays the channel breakdown based on activity levels for a topic on mainstream social media platforms.
While the search volume gives you an idea of a topic’s popularity on Google, the channel breakdown chart gives you insight into the relative performance of the trend on mainstream social media.
Another useful feature is the Related Trends table.
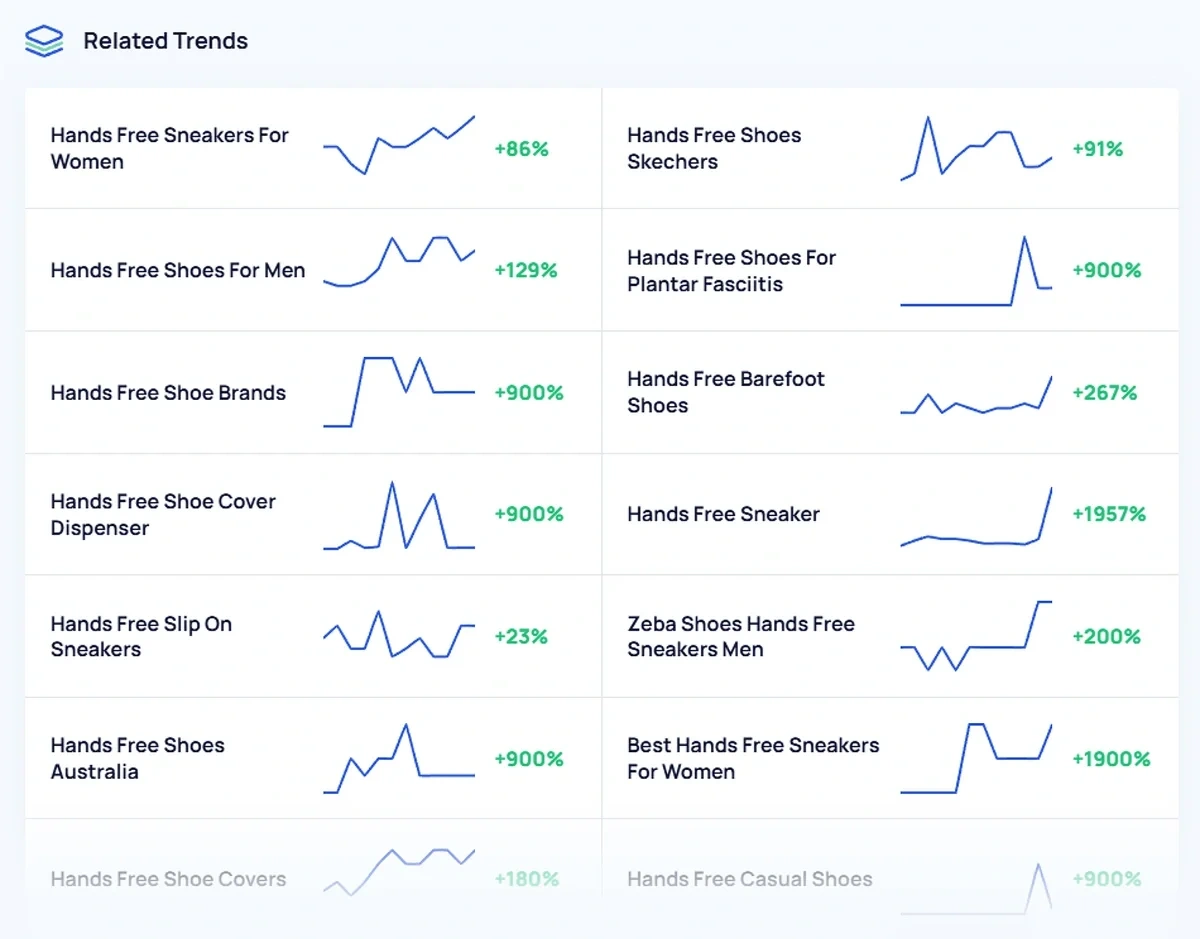
It’s a powerful source of keyword data for brainstorming content ideas.
On many occasions, I’ve discovered topics from this table that are even more promising than the main topic I’m investigating.
Treendly
The first thing I noticed about Treendly is that its database is significantly smaller than the Exploding Topics database. The Pro version of Treendly has around 12k+ trends in 16 distinct categories.
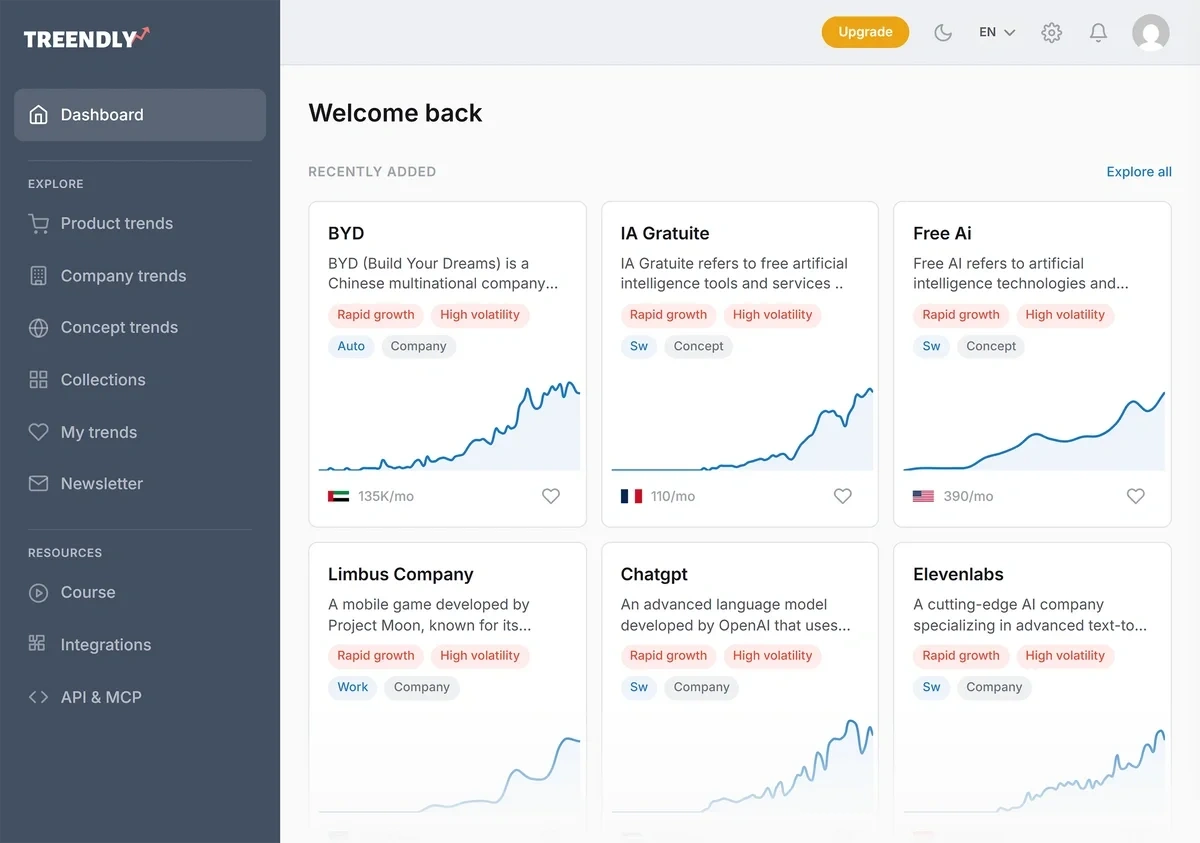
Treendly also has several similar filters to Exploding Topics. For example, you can filter charts by their growth levels and select different timeframes.
And it even lets you search for trends in several countries, which is a feature missing in Exploding Topics.
But Exploding Topics has an advantage over Treendly in several other ways.
One notable difference is that Exploding Topics supports a timeframe extending back to 15 years and as early as the last 3 months.
In contrast. Treendly lets you select a period of 5 years or 1 year.
Exploding Topics also has a very useful volatility filter for focusing on stable trends. It’s a feature that Treendly currently lacks.
Treendly’s main charts also use a different metric for measuring topic popularity on a scale of 0 to 100.
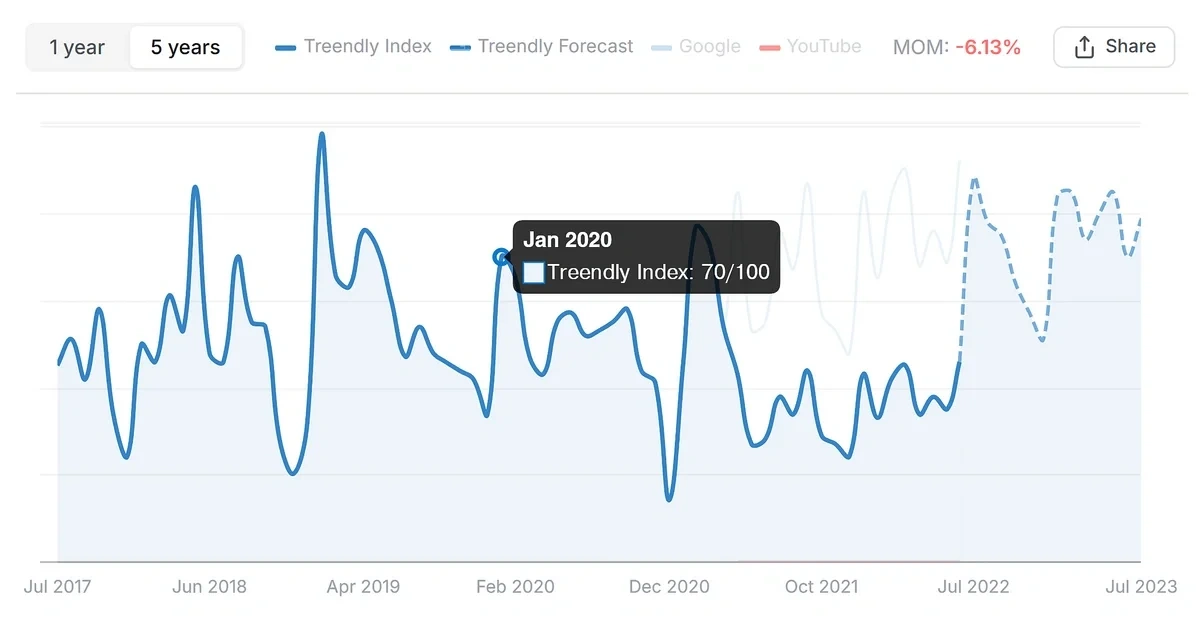
So instead of reporting search volumes for each month like Exploding Topics, you get a relative value that compares a trend with its peak popularity.
This is similar to how Google Trends measures interest in a topic.
That said, you still get a search volume figure for every trend if you want to know how popular something is in absolute terms.
I also like the summaries explaining why a trend is rising. The summaries are simple and provide helpful context about a topic.
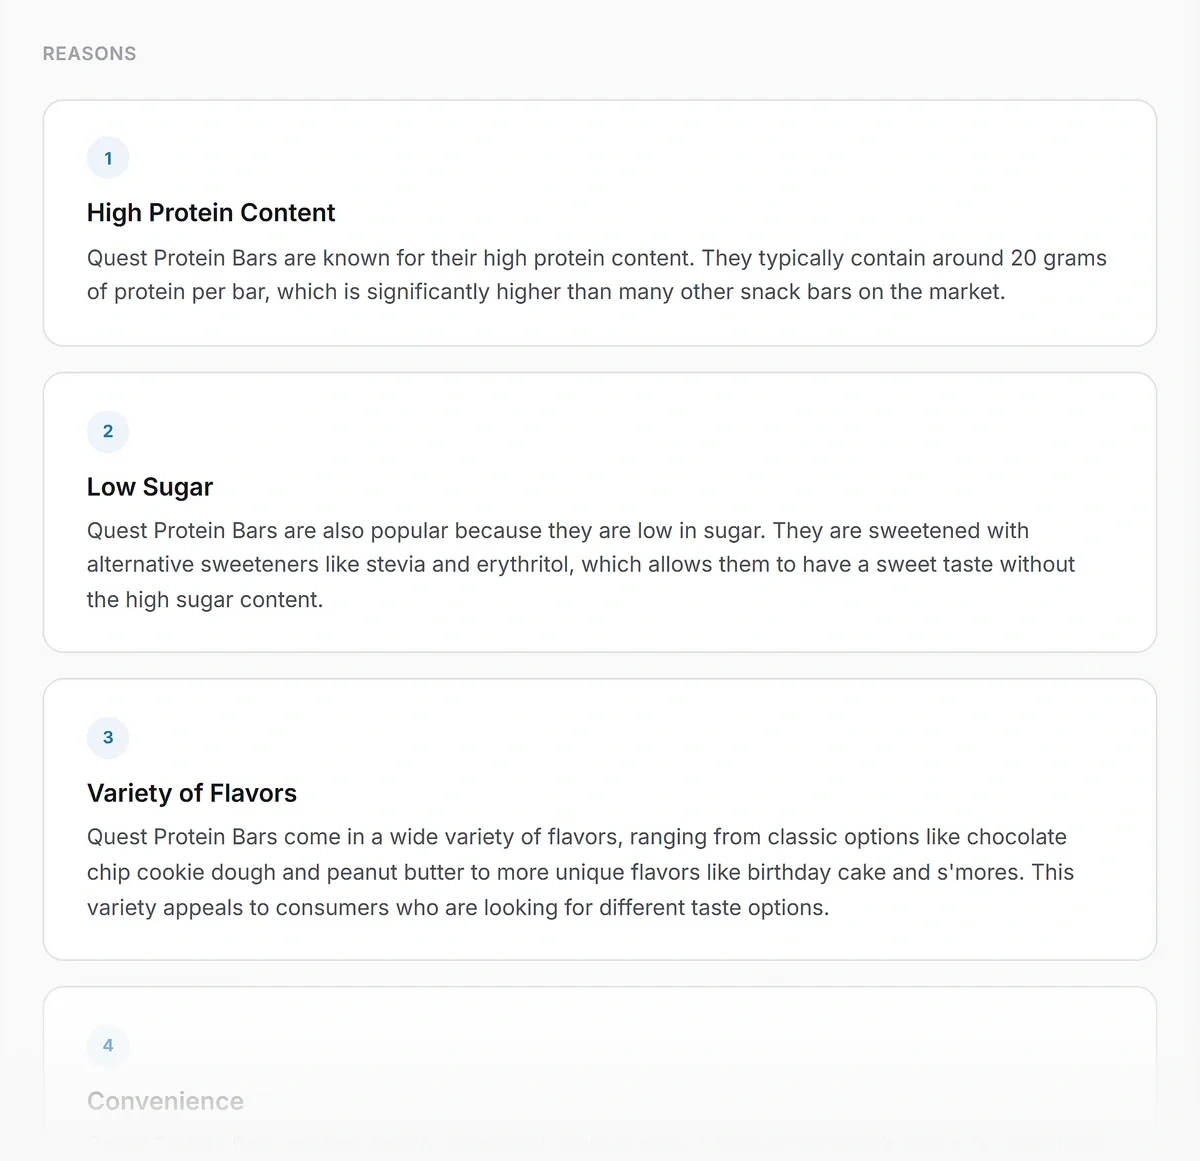
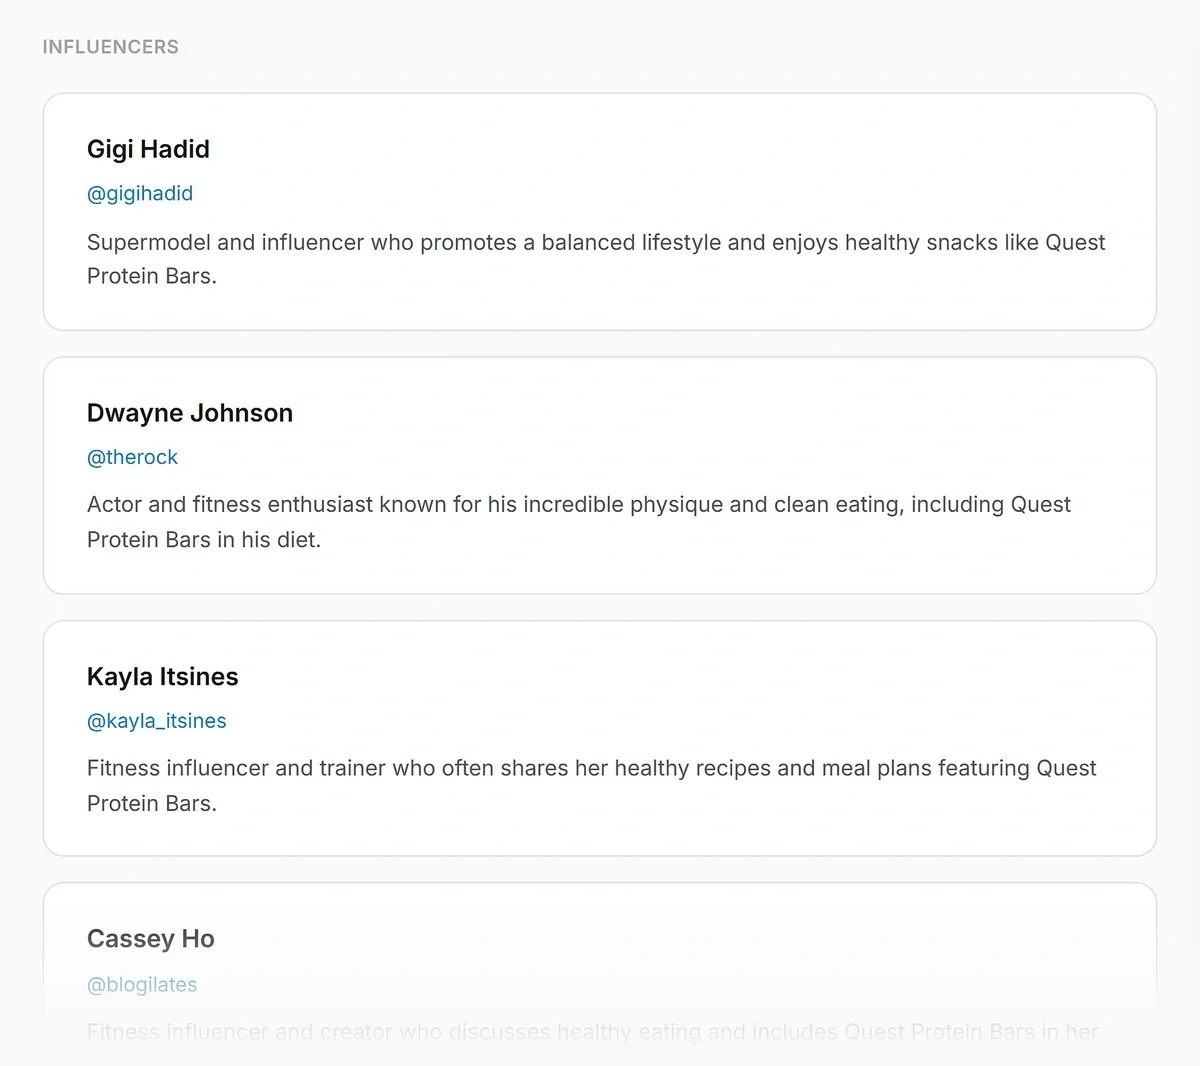
I was also pretty impressed to find a list of social influencers talking about the trend in question.
But I soon realized that the social links it pulls very often point to the wrong people. In almost every topic I checked, I found Instagram handles of private users with only a few followers.
And sometimes the links were broken.
The Channels feature includes four tabs that suggest relevant topics based on Google, YouTube, Pinterest, and Amazon searches.
I quite appreciate this feature for Amazon product research. It shows you useful ideas for related topics that can work really well for your keyword research and content planning.
It might also give you ideas for product inventory if you’re an e-commerce store.
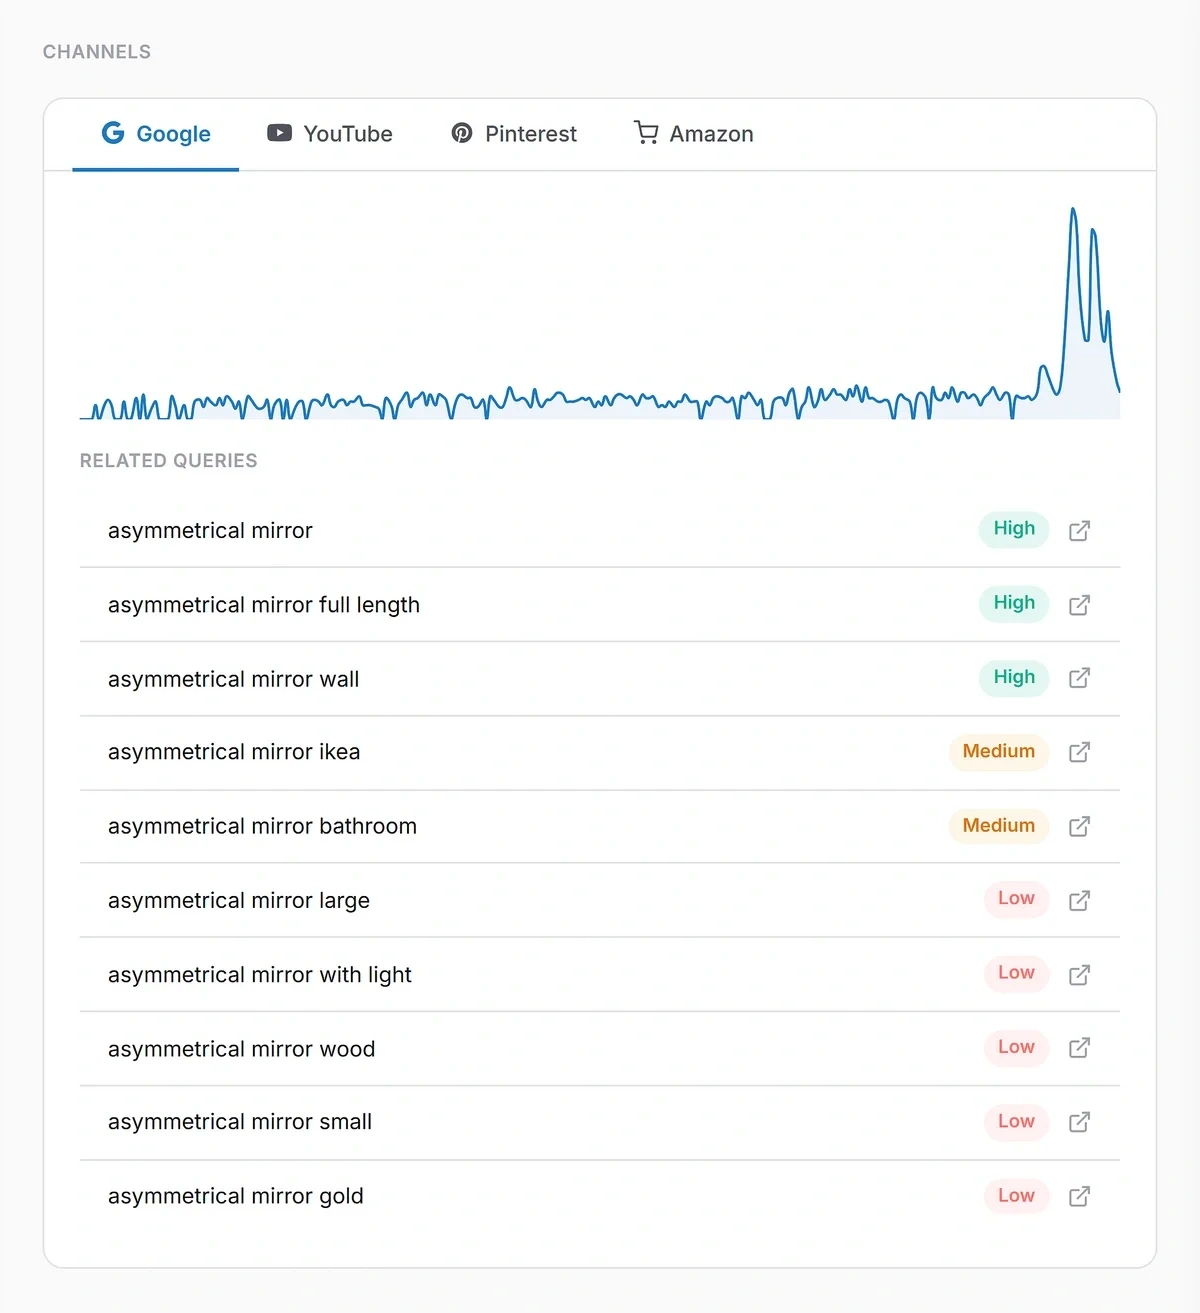
You can click any topic to search it directly on Amazon or YouTube. I’m a big fan of simple conveniences like these.
However, I do feel it would’ve been nice to see mini charts for each topic in the table, along with its growth or search volume metrics instead of value labels.
That would’ve made the quick analysis of related trends much easier.
Treendly also gathers forum discussions related to your topic.
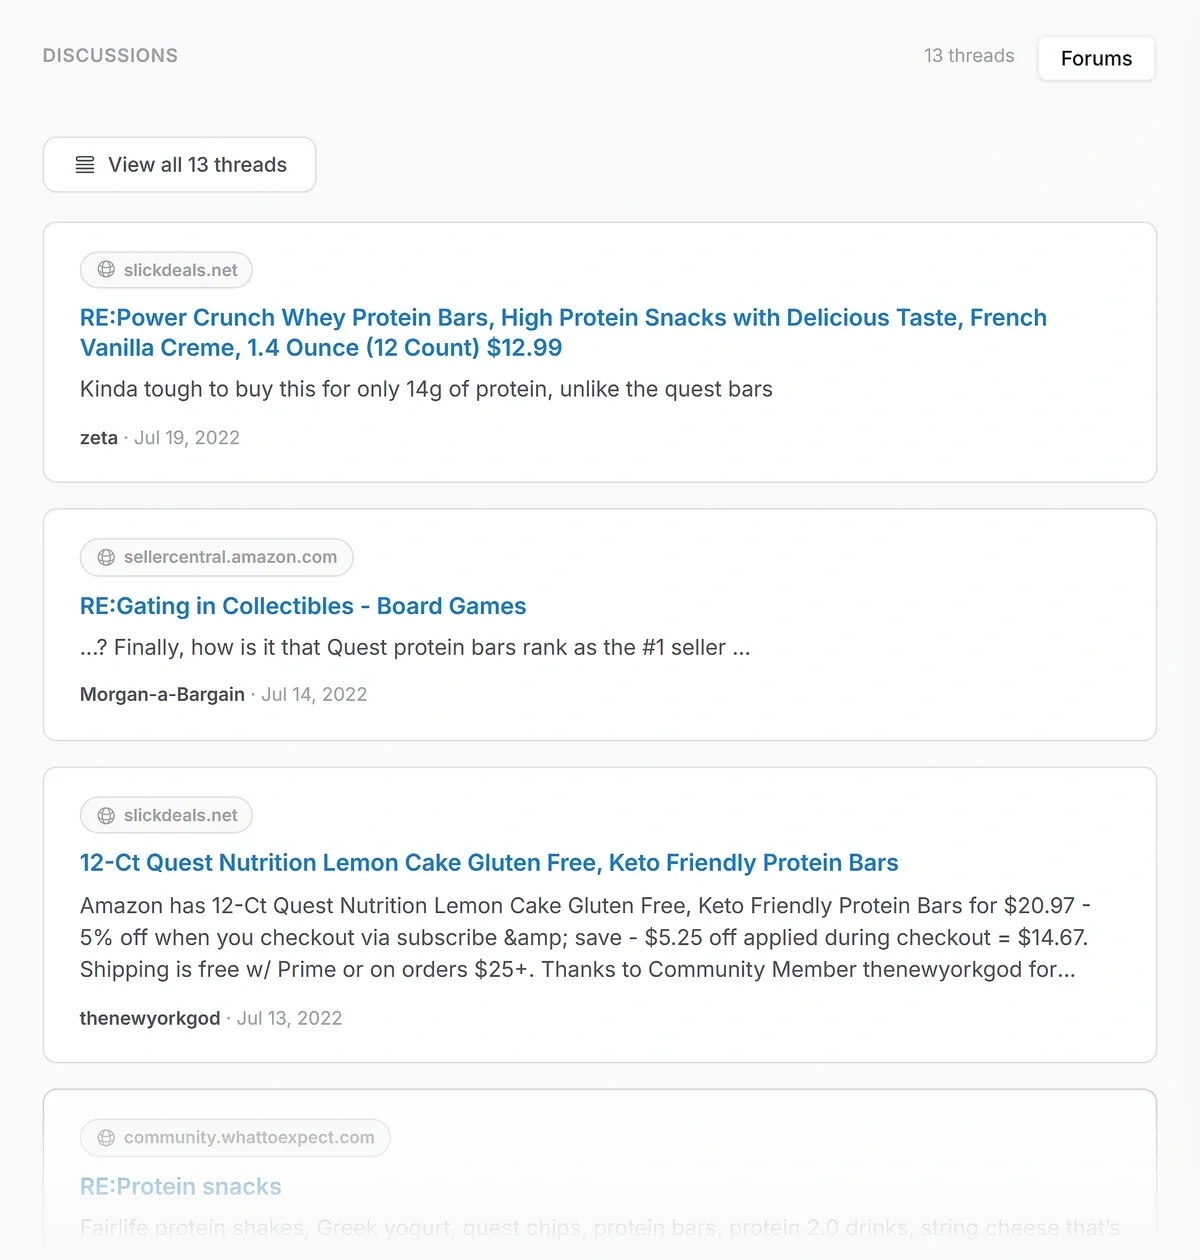
The idea is fantastic. But the execution is so underwhelming that the feature is hardly practical.
All you get is a carousel displaying the thread title of a post and a comment snippet.
This would’ve been far more useful if you got an analysis of the discussion in terms of engagement, popularity of different forums, and user sentiments instead of text snippets.
For example, Exploding Topics handles this much better by showing you a channel breakdown with a spider graph.
Comparisons of topic popularity on different social platforms are a more actionable piece of information than comment snippets from obscure online forums.
You can see our full review of Treendly here.
Trending Products
My verdict: Exploding Topics provides deep insights for e-commerce stores with the Trending Products report. It goes beyond growth charts and search volume with revenue, price, sales, related products/sellers, and optional TikTok Insights (videos, hashtags, activity trends). Treendly adds branded-product and country filters, a much smaller database, and largely lacks product-specific profitability data needed for strategic decision-making.
Exploding Topics
Exploding Topics has a separate section for finding trending products.
You get tons of additional data points along with the ability to filter trends using a variety of metrics.
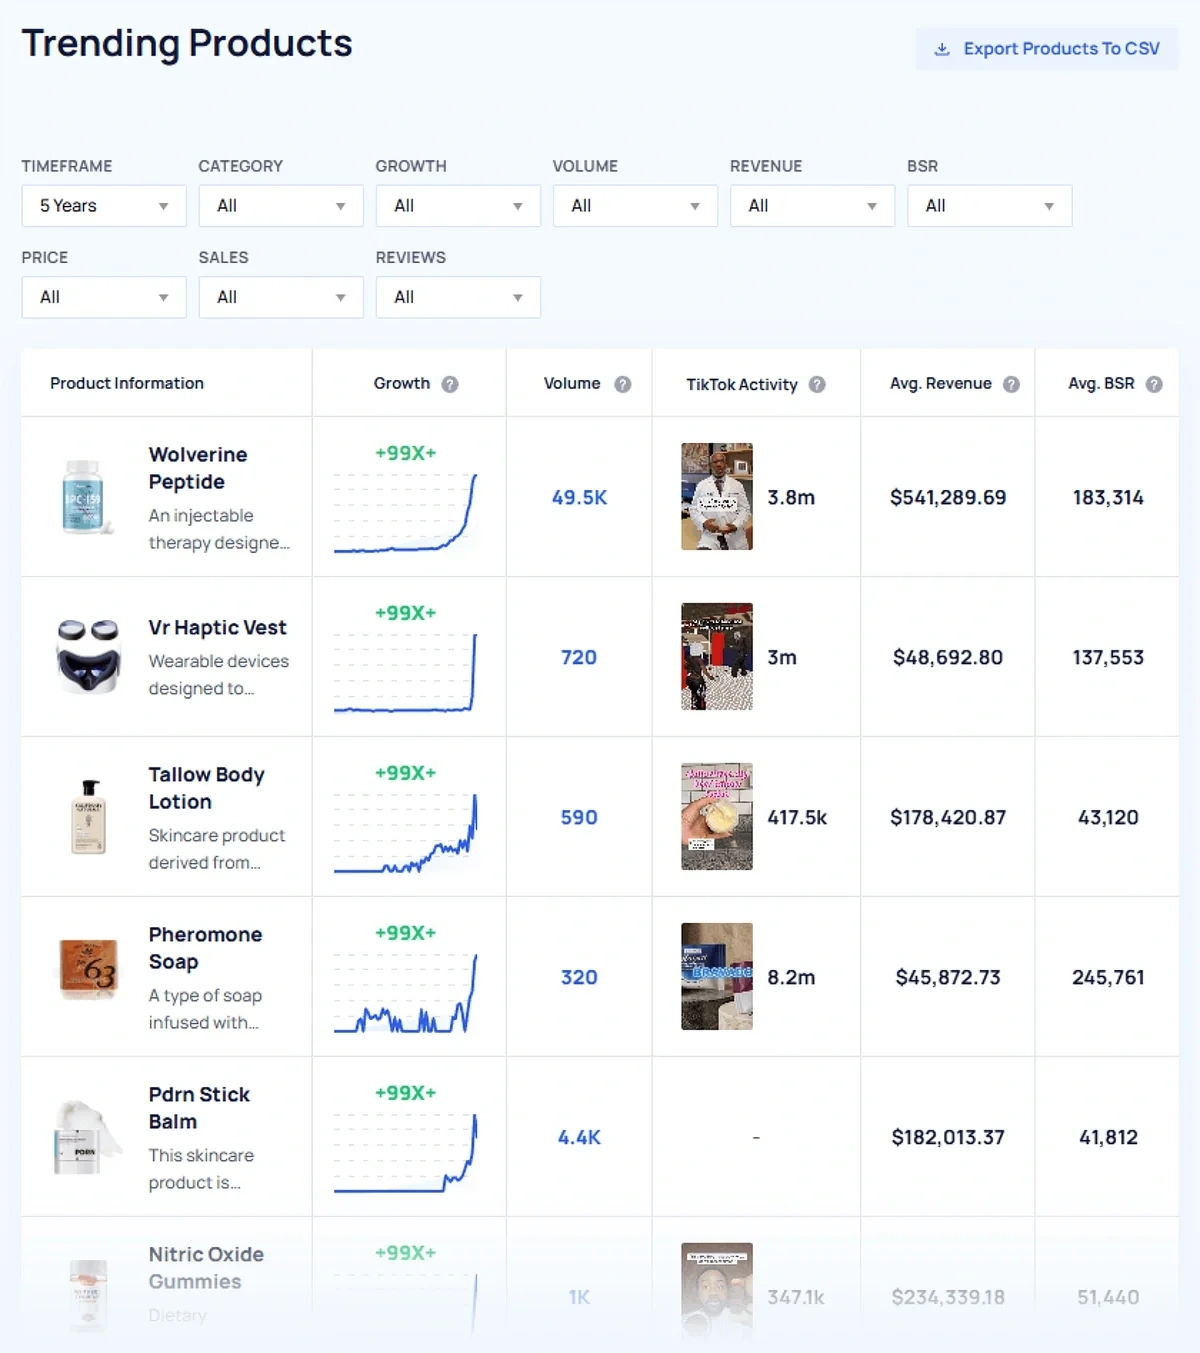
The Growth and Volume columns immediately reveal if a product is trending upward and how high its monthly searches are.
Great to keep an eye on these two columns as you’re scanning through the table for profitable products to consider for your store.
But what makes Exploding Topics so powerful for product research is that it pulls product-specific details, including:
- Revenue
- Amazon best-seller rank
- Product price
- Sales
- Reviews
Things get even more interesting if you have the TikTok Insights add-on.
This gives you an additional column highlighting TikTok activity for each product.
And if you need to dig deeper, you can click on a product trend to learn more.
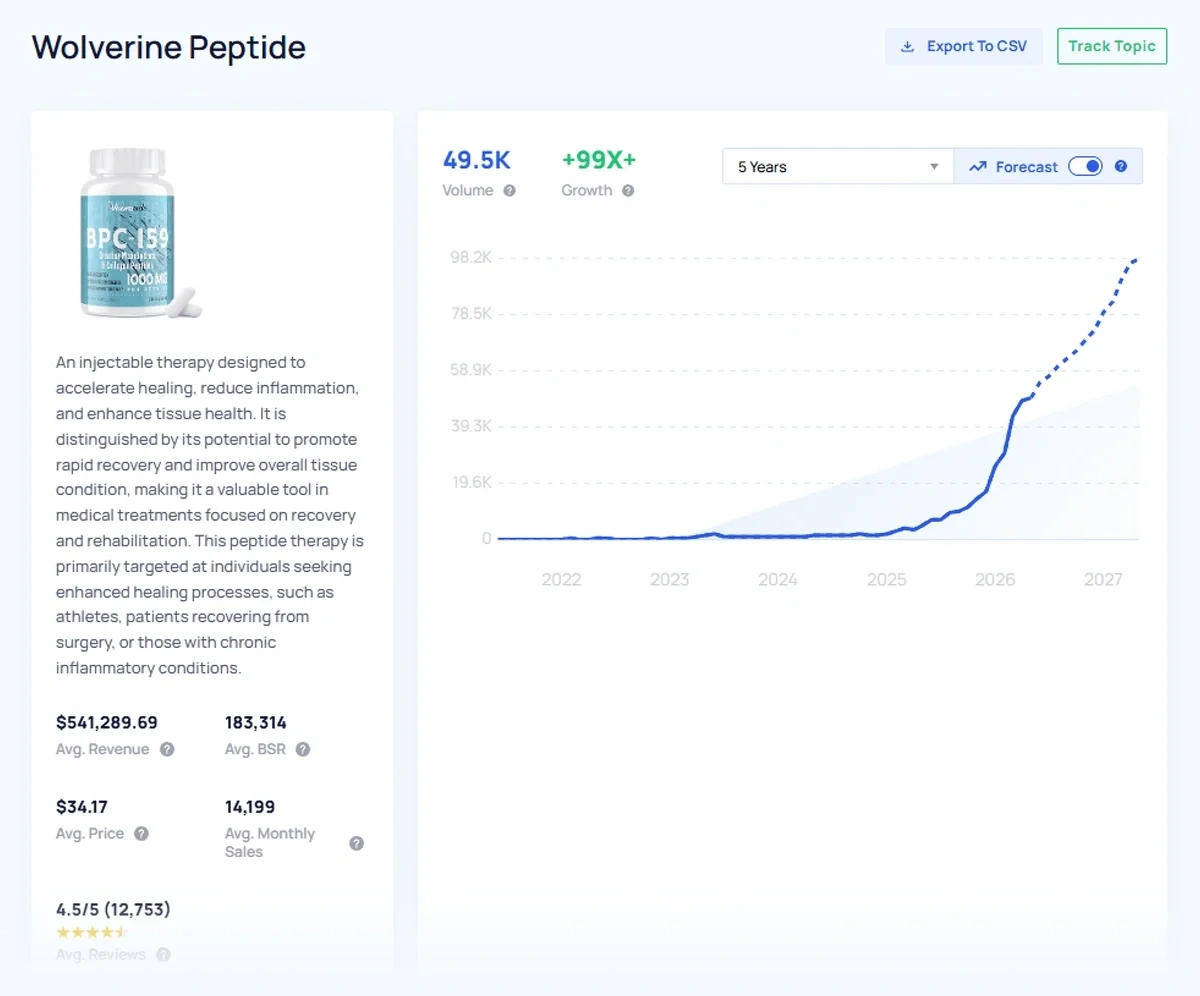
Once inside, the app will show you a trend chart with its 1-year forecast.
You’ll also get a summary of the product explaining its key features and benefits, along with its sales metrics.
These descriptions are super helpful when you want to quickly familiarize yourself with a product you don’t know about yet.
As usual, there are key insights about the trend’s growth trajectory along with channel breakdown illustrating the product’s popularity on different platforms.
I like the extra insights available by clicking the horizontal tabs.
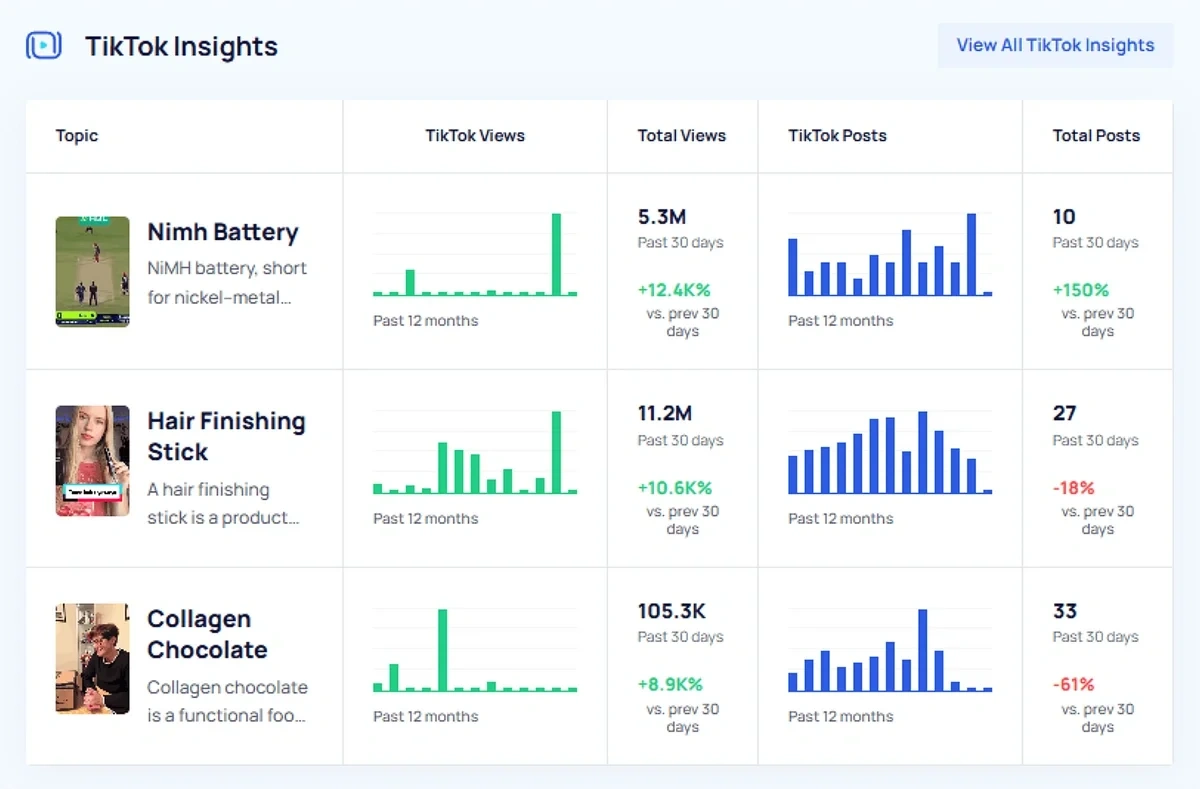
The TikTok Insights tab brings TikTok-focused metrics about a product, including related posts and total views, and likes count.
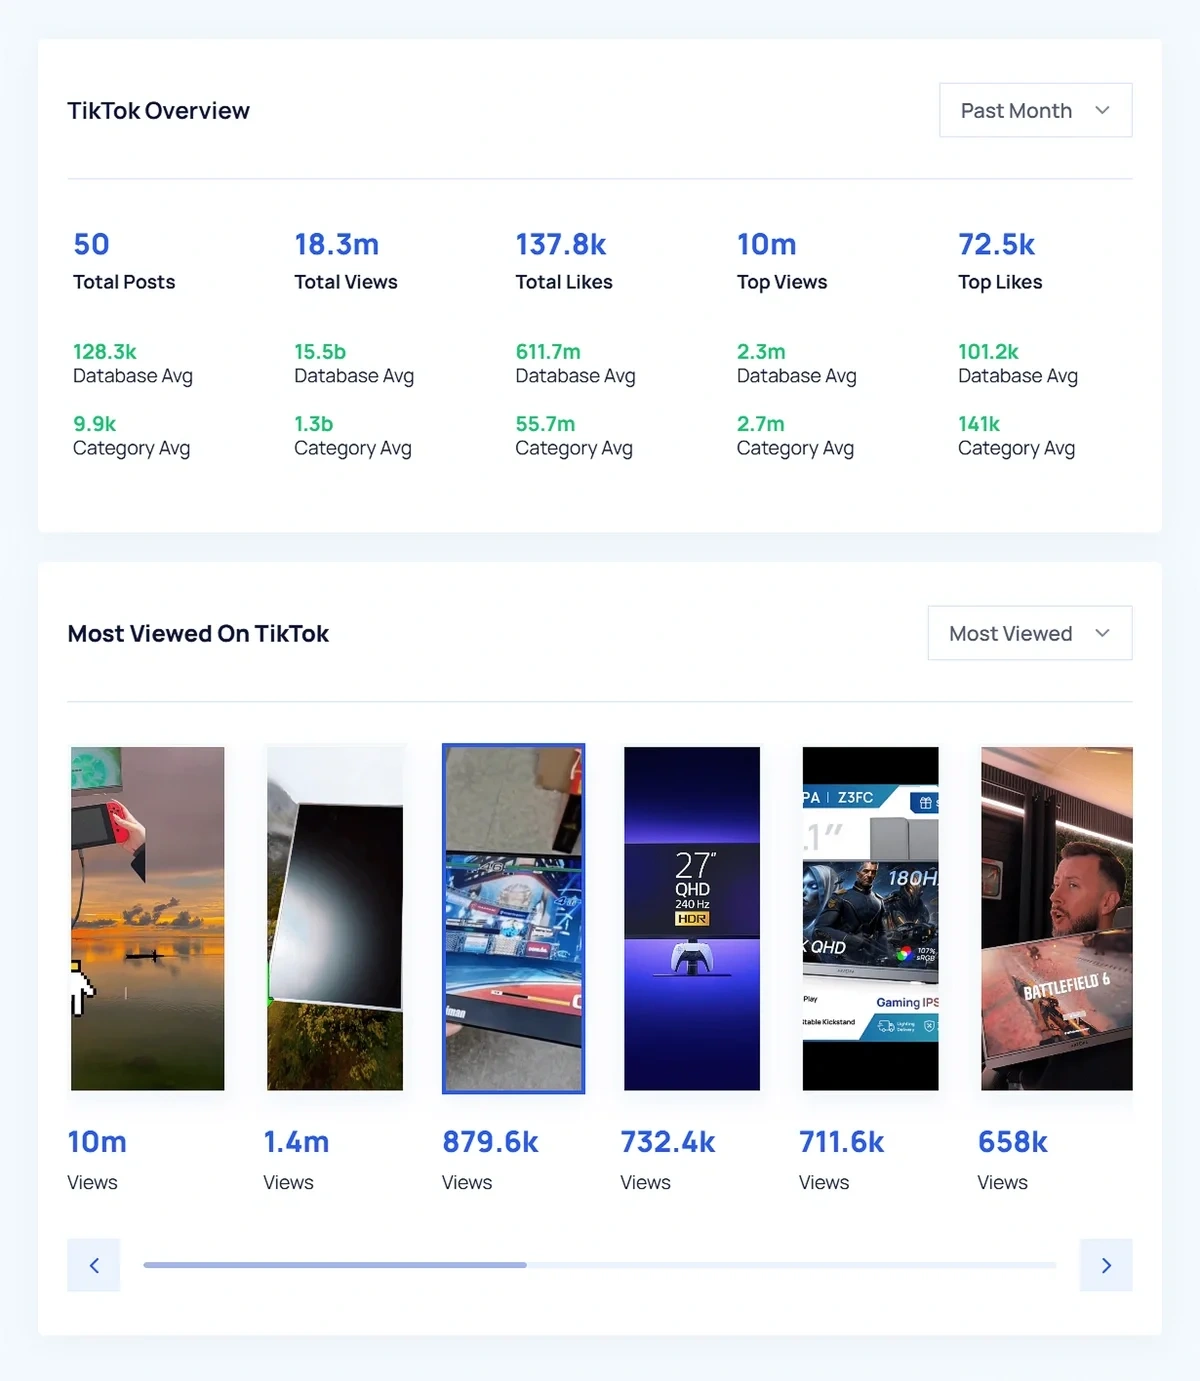
The TikTok video carousel is really nice to have as well.
It fetches the most relevant and popular videos on TikTok that are discussing or promoting the product in question.
And you can click any video to view it directly on TikTok.
The time series illustrating TikTok activity is a fantastic piece of data because it lets you understand the relationship between views and posts.
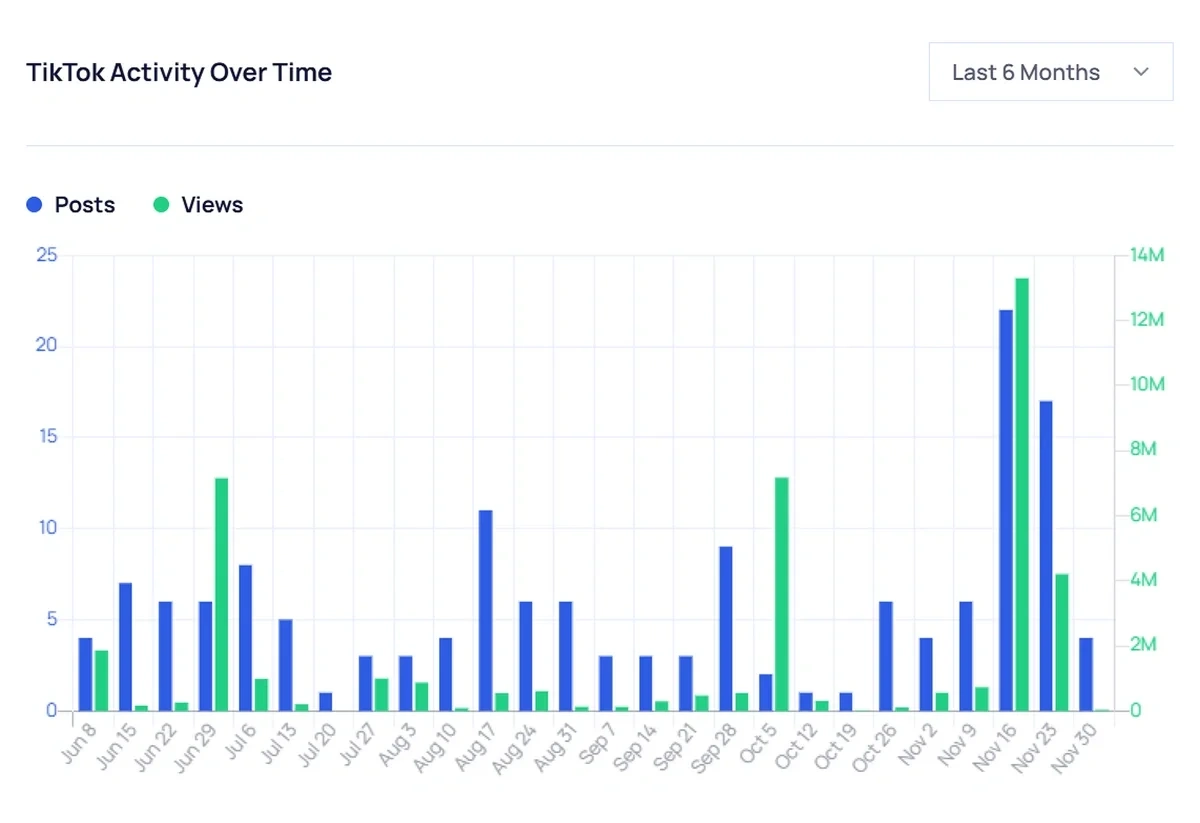
It’s not unusual to see a delay between posting an activity and the growth in views that results from it.
Viral trends sometimes take a while before they reach peak momentum.
The key is to recognize these patterns so you can make informed decisions for your product marketing and sales strategy.
These charts serve that purpose wonderfully well.
To top it off, the add-on also includes hashtag analysis.
It’s a simple bubble chart representing the hashtags that people are using to discover videos related to the product.

Quite useful for TikTok product research, whether you’re performing market research or looking for the right hashtags to promote your own product content.
To take your product research further, the Top Sellers tab reveals different Amazon stores selling the same product (or different variants of it).
This will immediately tell you which stores are selling the most items, their product pricing, and average reviews.
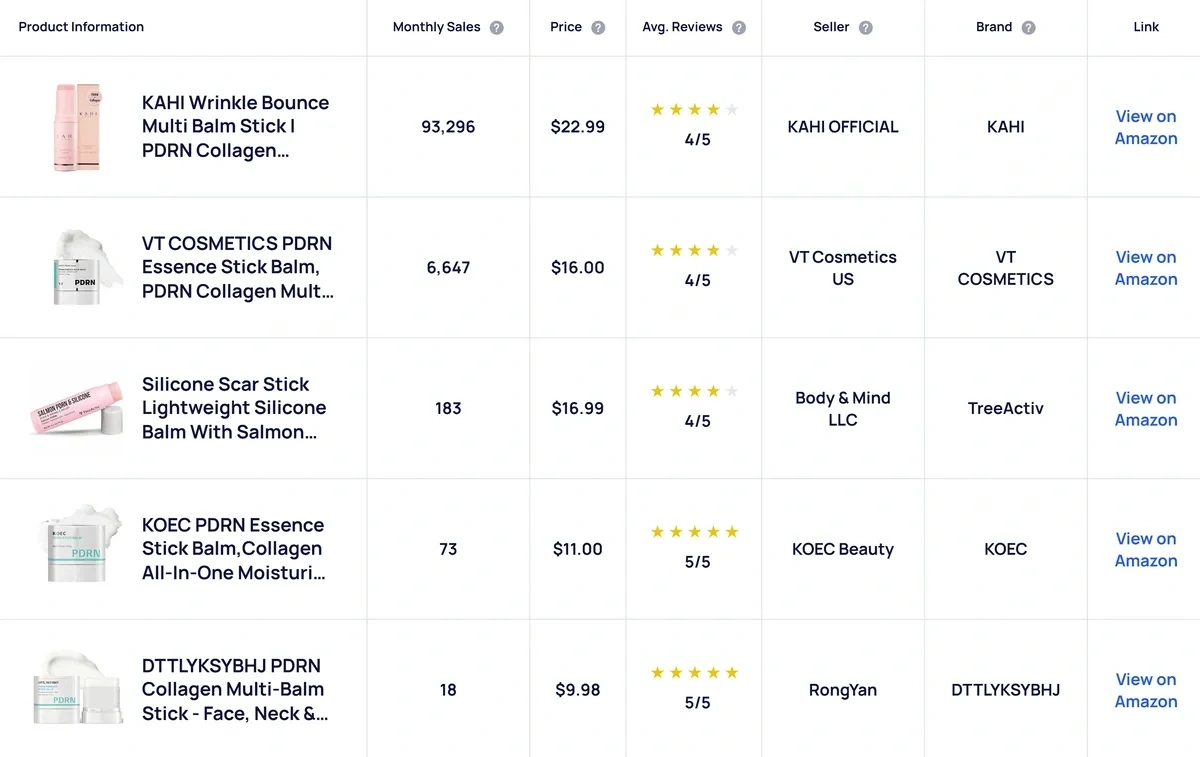
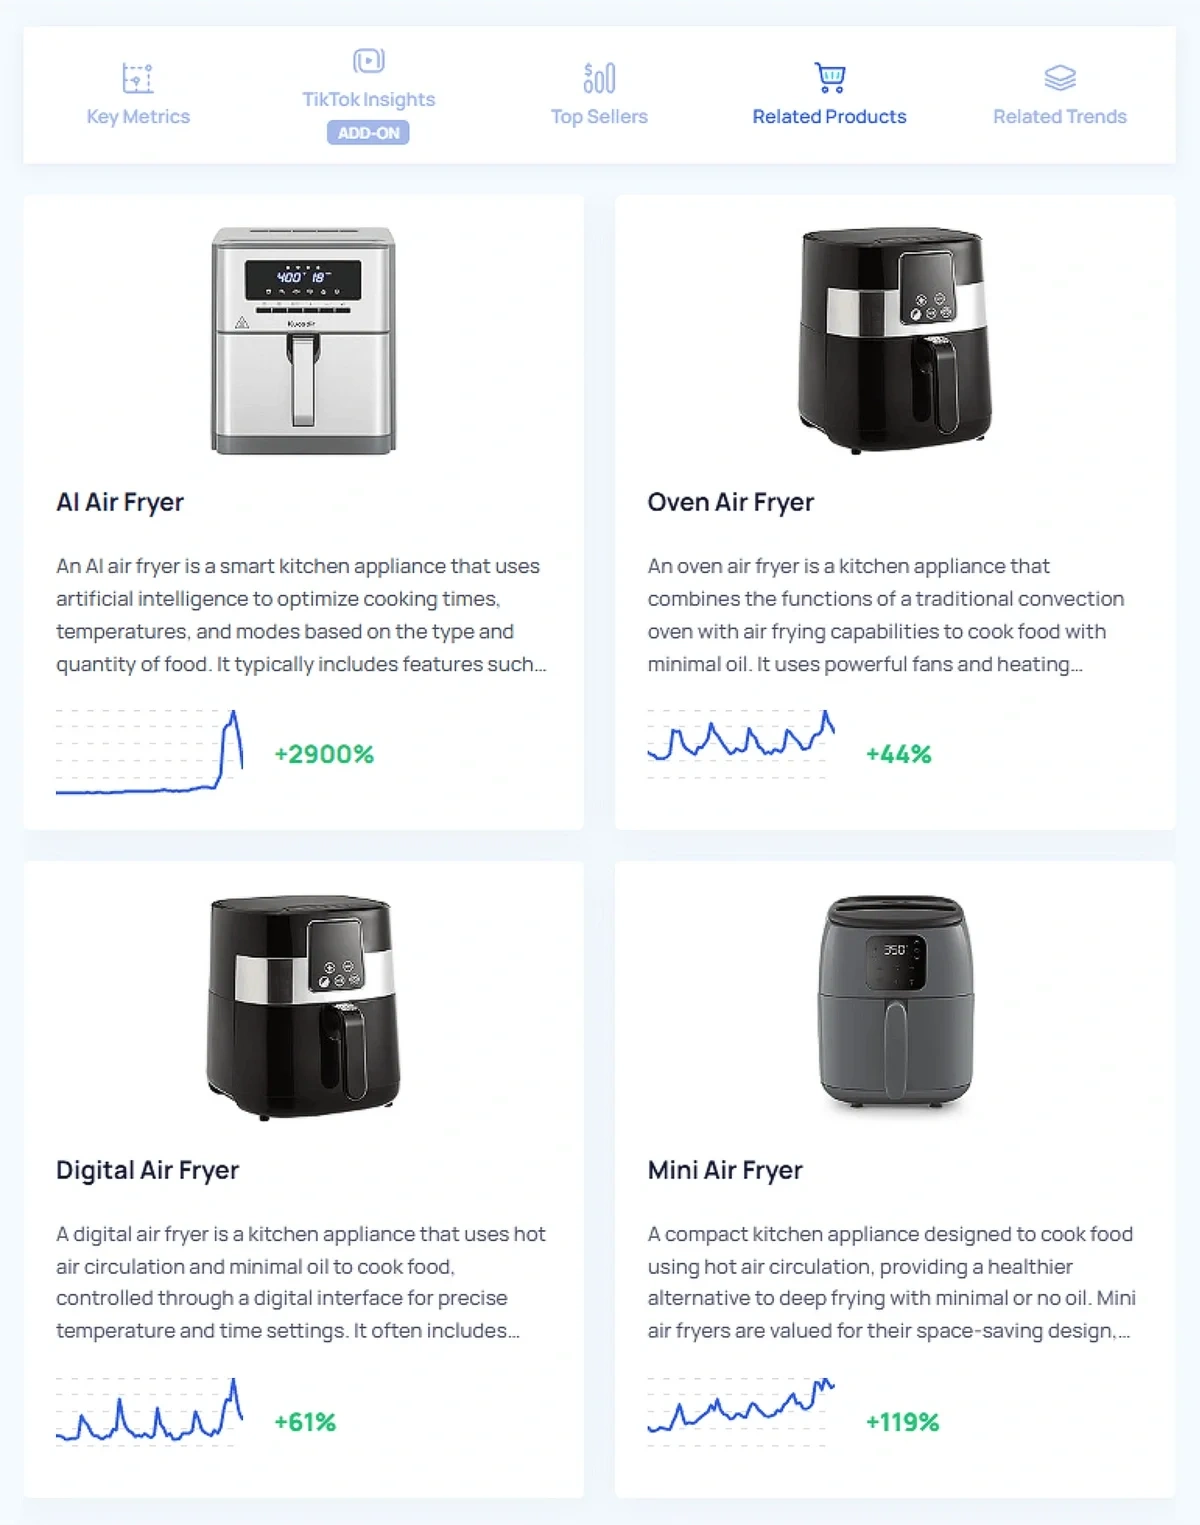
It’s always worthwhile to check out the Related Products tab.
Quite often, you can discover an even more popular product with a stronger trend projection than the one you’re currently investigating.
Once again, it’s nice being able to see a mini trend chart and growth percentage under each product.
You don’t have to wait until you’ve opened each product trend page separately to see what its trend chart looks like.
Finally, there’s the Related Trends tab. This is what you’ll be using if you need content ideas for a product.
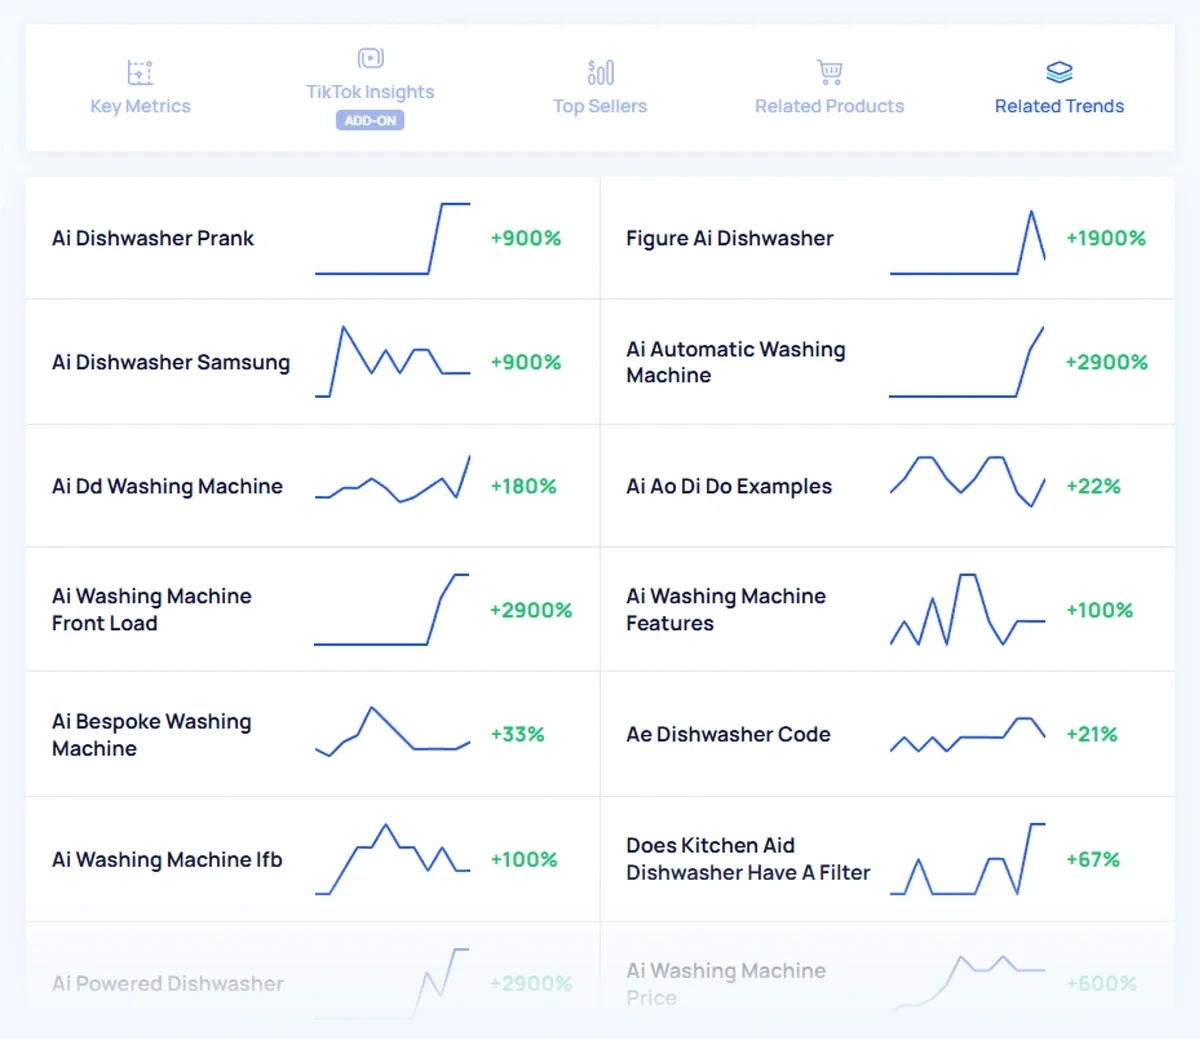
It makes perfect sense to use these as trend-based keywords for your content cluster.
You can use these ideas to prepare a content brief and identify the best keywords for your content cluster.
All the features in the Trending Products report are quite simple on the surface, but they’re exceptionally designed for some quality product research.
E-commerce stores can easily find strong opportunities for selling in-demand products and find inspiration for promotion on social channels by spending just a few hours exploring these product trend reports.
Treendly
Treendly has a trending products report where you can search for popular products specifically.
It comes with the same set of metrics and filters as the trend report for concepts/topics.
I noticed an additional filter that shows you branded product trends only. This is quite a welcome one.
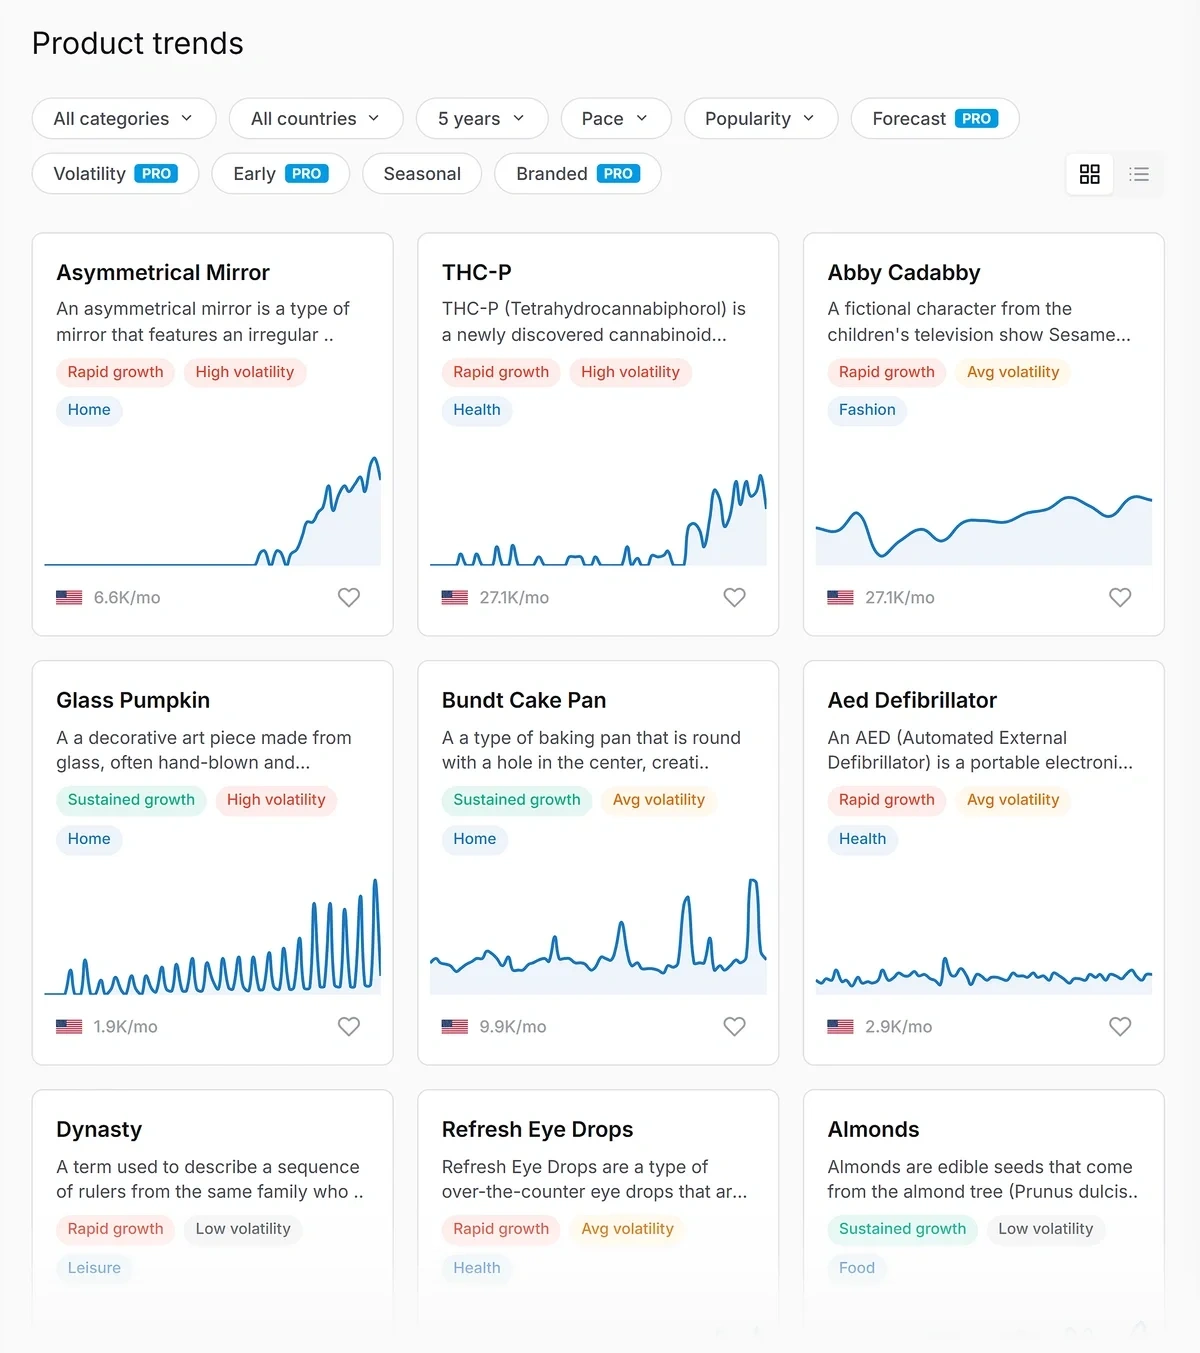
If you’re interested in checking product trends on a regional level, you have the country filter at your disposal as well.
These are valuable features to have for any e-commerce store conducting research for trending products.
But when I compare Treendly’s product trends with Exploding Topic’s, the difference is huge.
With Exploding Topics, you not only get trend charts and search volume for product trends, but also a wealth of product-specific data such as pricing, revenue, sales, and reviews.
All of these data points can be used to filter through the product trends database as well, which is a powerful feature.
In contrast, Treendly gives you the same metrics for products that it does for general trends.
There’s a lack of sales, revenue, price, and review data. That information is crucial to validate the profitability of a product, so it’s quite a big omission.
Even when you click open a trend chart, the product page still provides the same trend-related data without any additional product insights.
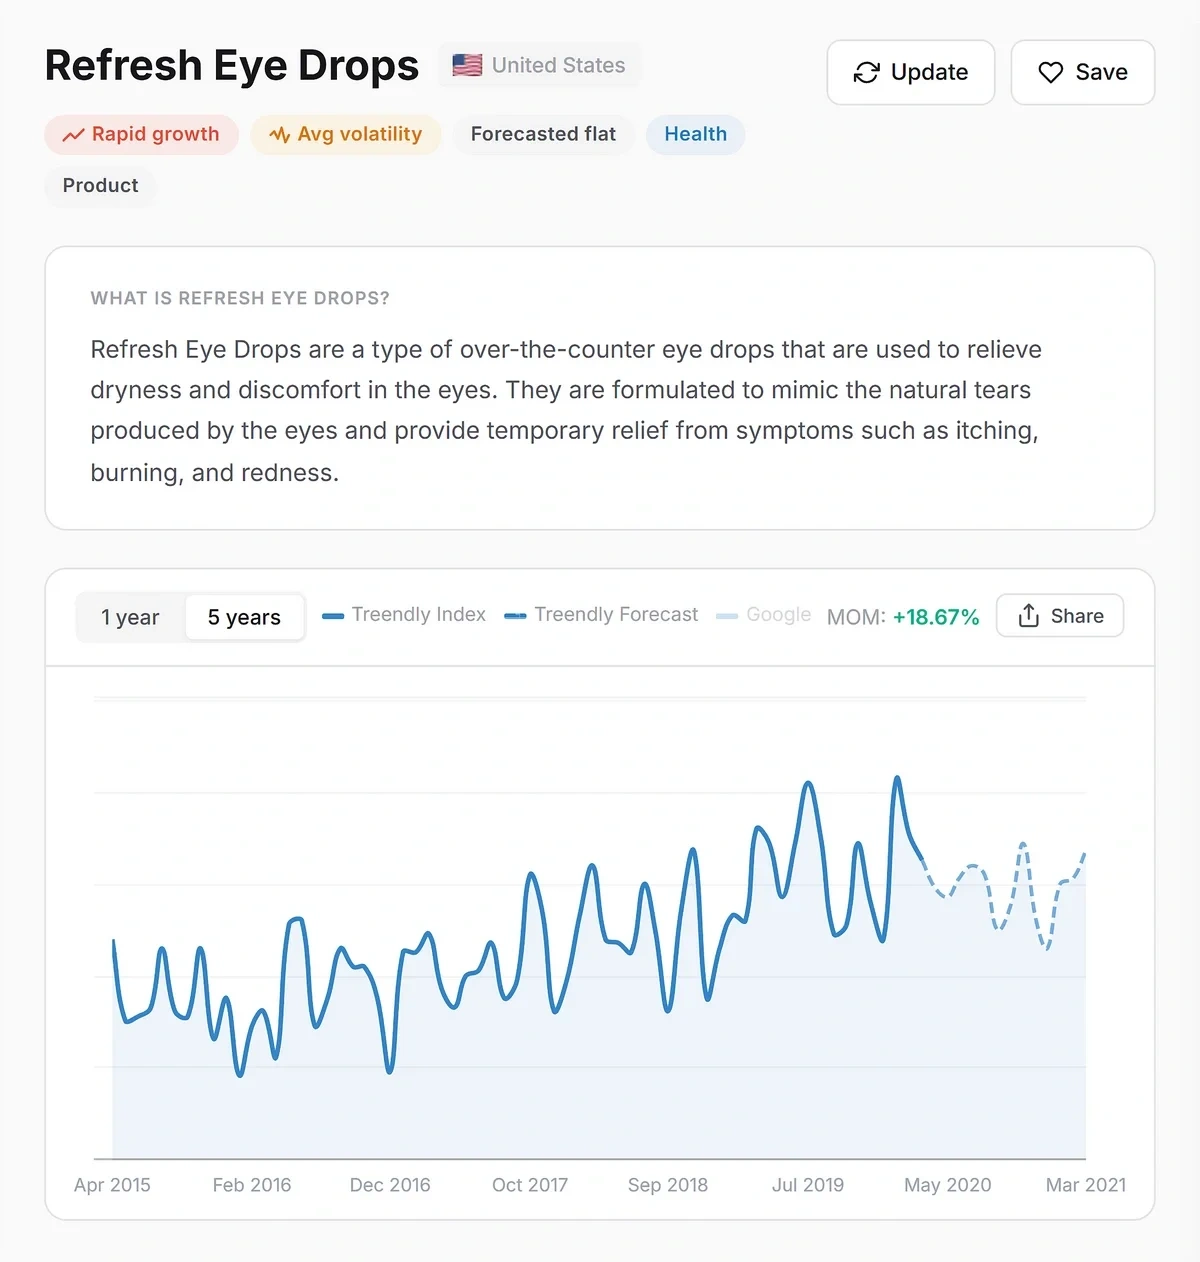
These limitations set back the utility of Treendly as a product research tool, especially when stacked up against the quality of insights you get with Exploding Topics.
Startup Trends
My verdict: Exploding Topics’ startup directory pairs search trends with useful context for investors. You get search volume growth %, current volume data, funding details, latest round, and employee count to spot early signals vs hype. Treendly’s Company Trends mostly mirrors its generic trend data, lacking funding/size context for data-driven investors.
Exploding Topics
Apart from topics and products, top trend analysis tools also enable you to analyze emerging startup companies for informed investment decisions.
The Exploding Topics startup directory is ideal for discovering companies with rising search volume trends.
The great thing is that this report supplements trend charts with important stats about companies useful for investors.
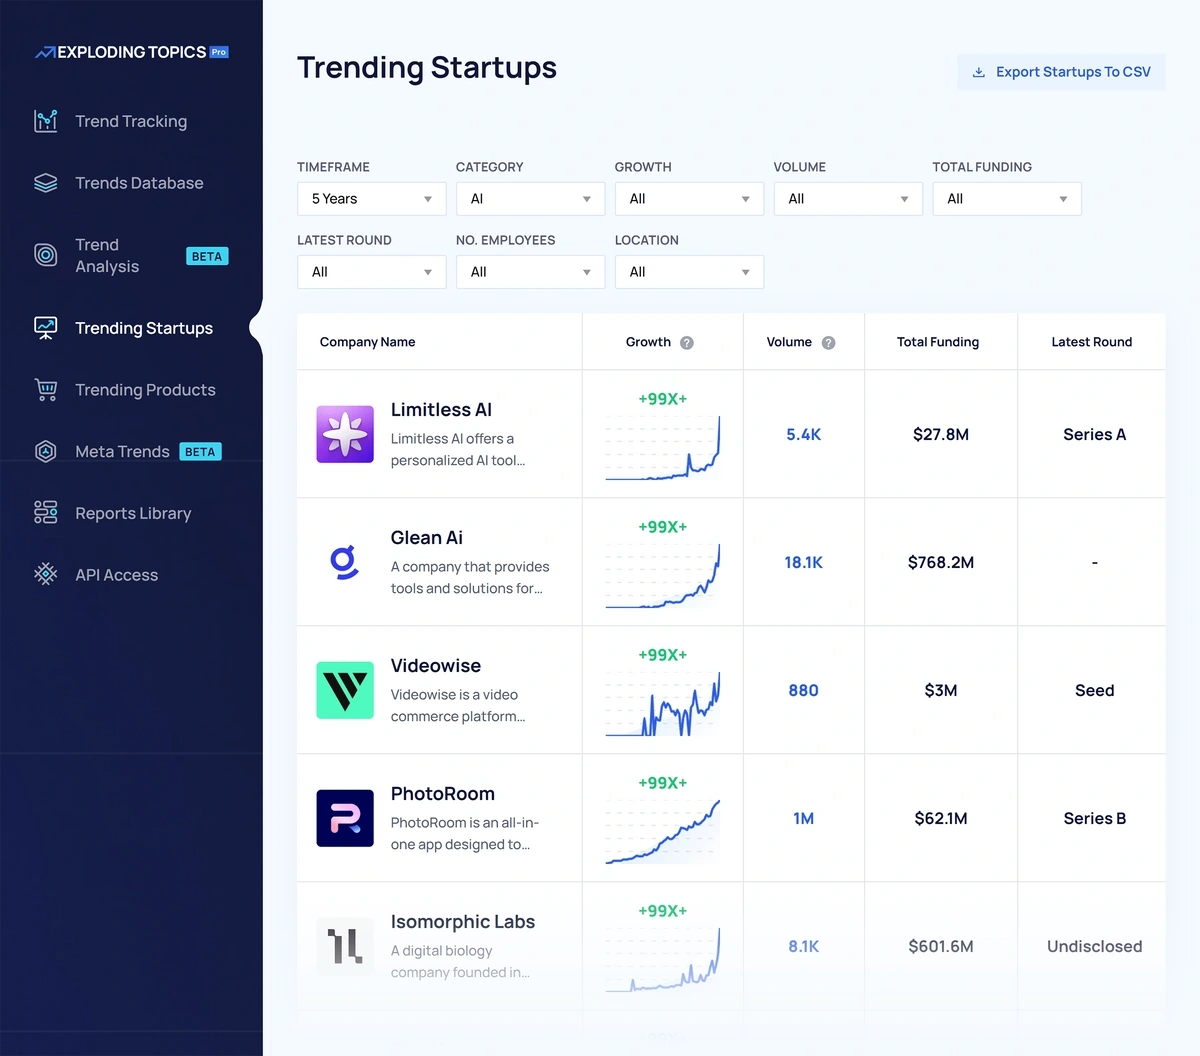
So, in addition to growth % and search volume, you also get:
- Funding information
- Latest round of fundraising
- Company size in terms of employees
It’s the perfect set of data identifying early signals before a company gets mainstream coverage.
Looking at the growth and volume columns along with the latest round will tell you if a company is just hype or if there’s real growth attached with its ascending search trend.
For example, a company with big funding but negative volume growth is a potential warning sign.
And a bootstrapped company enjoying rising popularity is a potential investment opportunity for scaling growth.
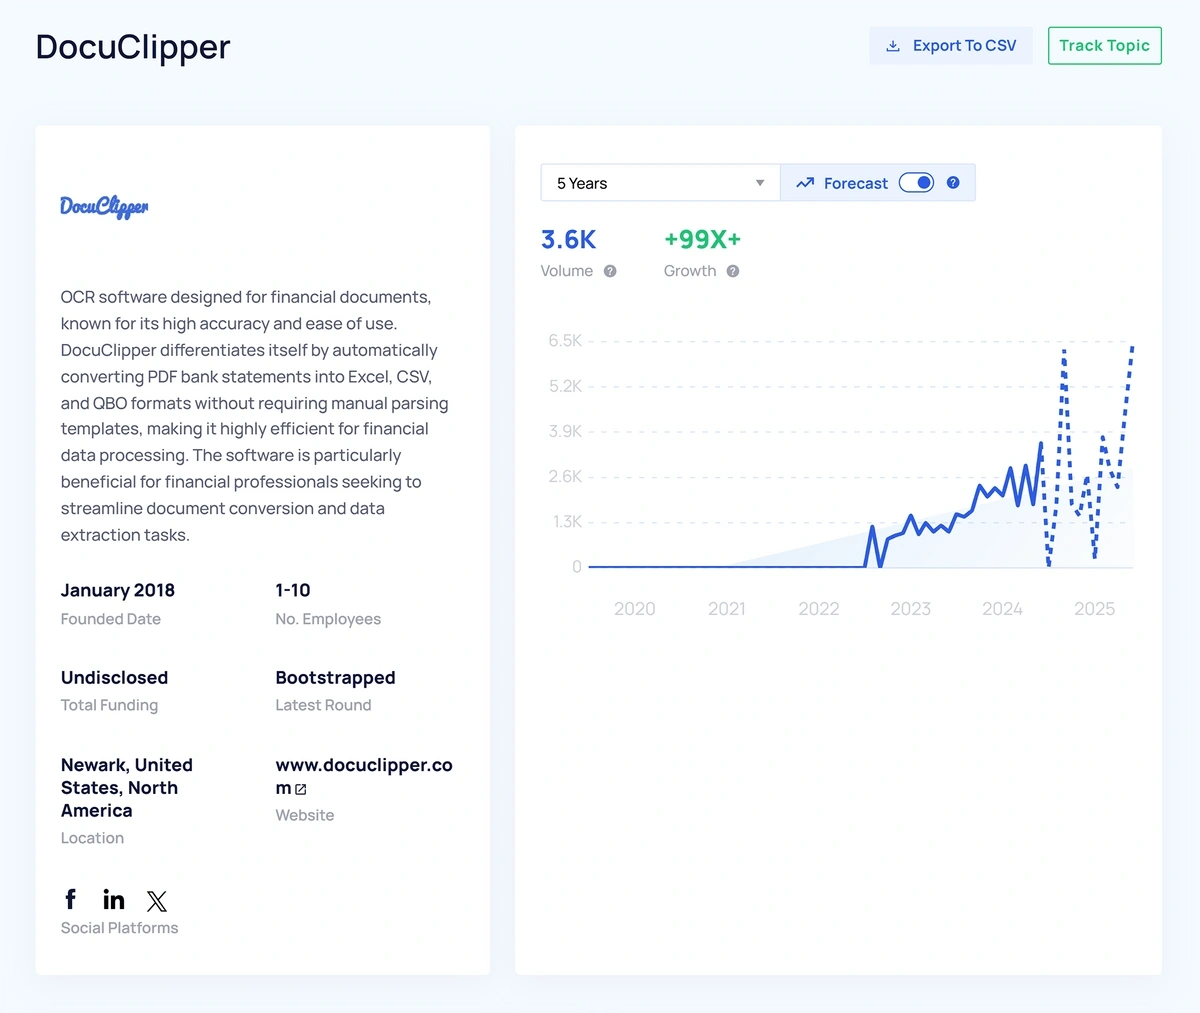
You’ll also find a summary of a company, when it was founded, links to their website and social media, and the country of origin.
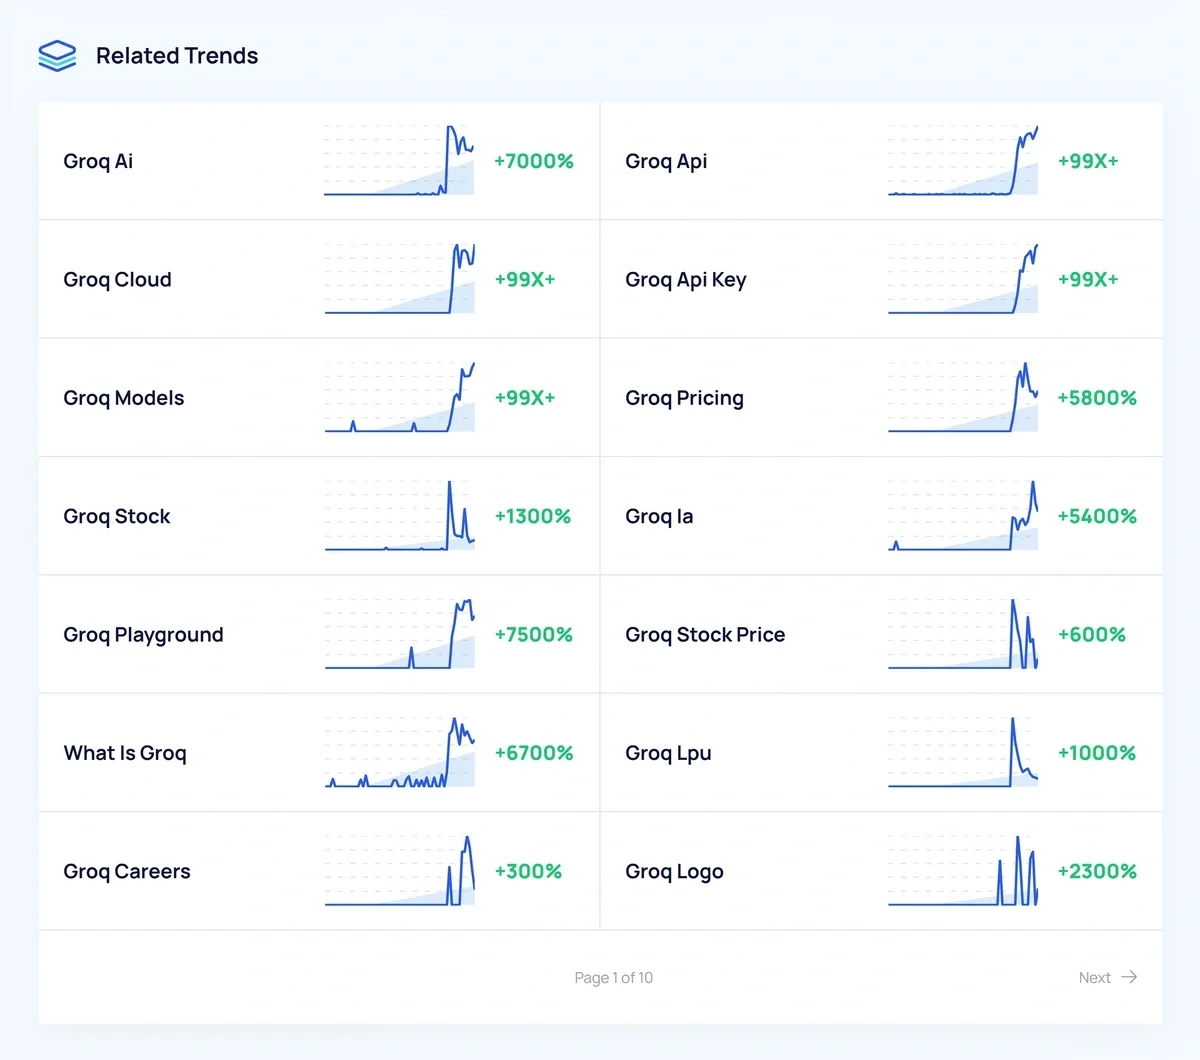
It also helps to take a look at trending keywords related to a company.
This can reveal attributes of a company that users are searching for, such as pricing.
If you’re an investor, you’ll find great value in using the Exploding Topics startup directory with its carefully selected set of metrics that support good decision-making.
Treendly
Treendly offers a company directory as well, accessible from the Company Trends tab.
While it’s a handy feature that shows you search trends of companies, I was disappointed to see that it doesn’t give you more useful context beyond that.
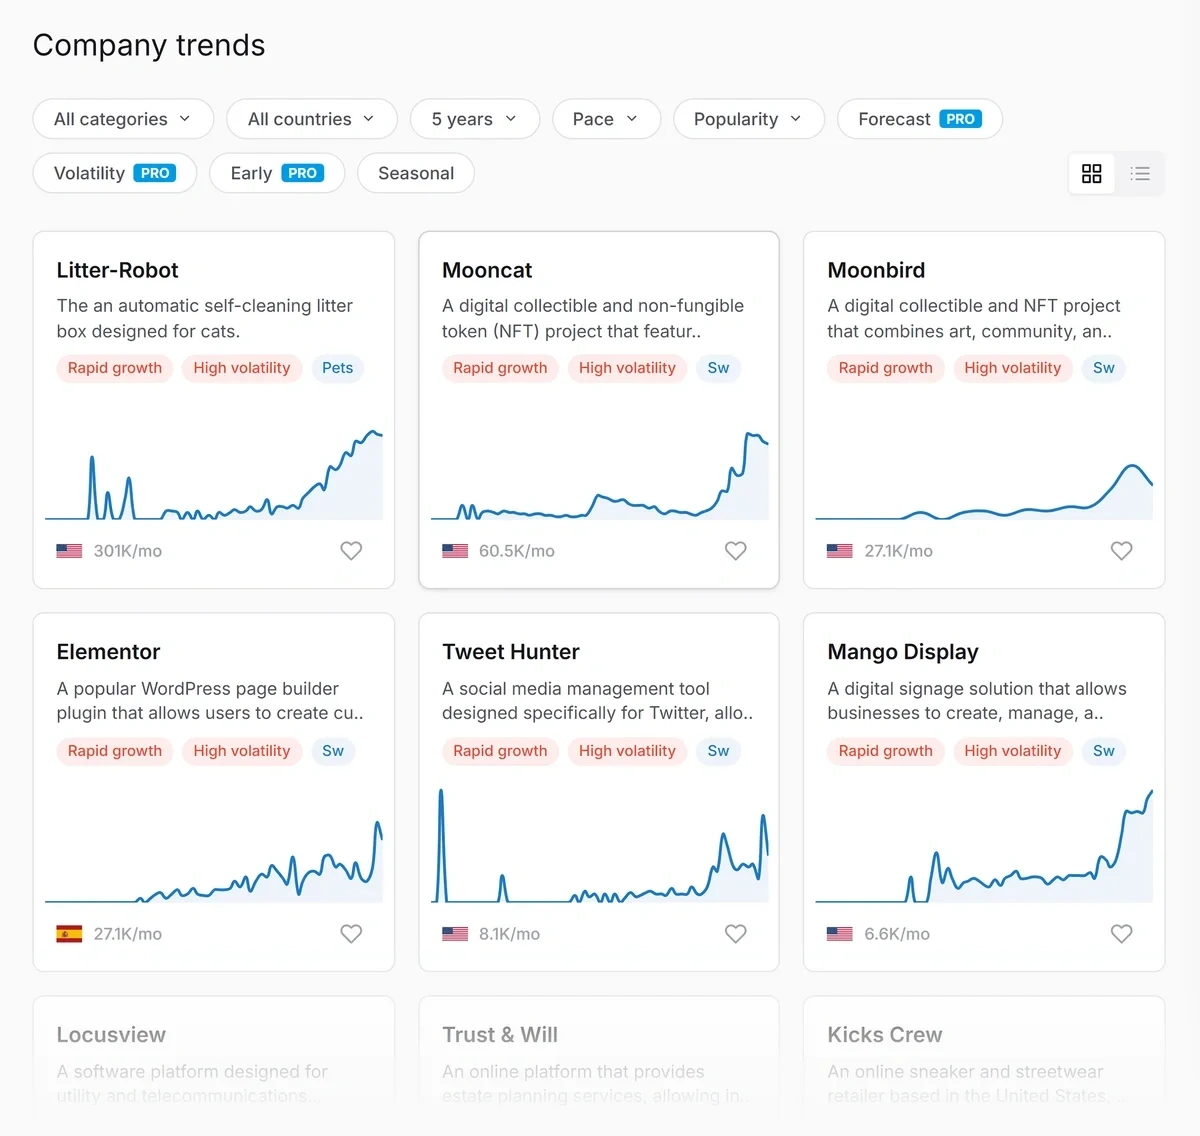
You get exactly the same set of data points and filters as what you find in the product and concept trend reports.
That means there’s no information about funding, the latest round, or company size.
With only search volume trends to go on, you can’t reliably make decisions about a company unless you manually dig up other details online yourself.
I find Treendly quite lacking in this regard, especially when alternatives like Exploding Topics exist for investors.
Unique Features
My verdict: Exploding Topics just feels more “complete” here. Meta Trends for deeper niche insight, a clean tracking dashboard, weekly curated reports, and an API to send its data into custom dashboards. Treendly’s extras are thinner: trend tracking plus an API with 1–5 year and geo data, but it doesn’t go much further.
Exploding Topics
Exploding Topics offers a lot of value with extra features like:
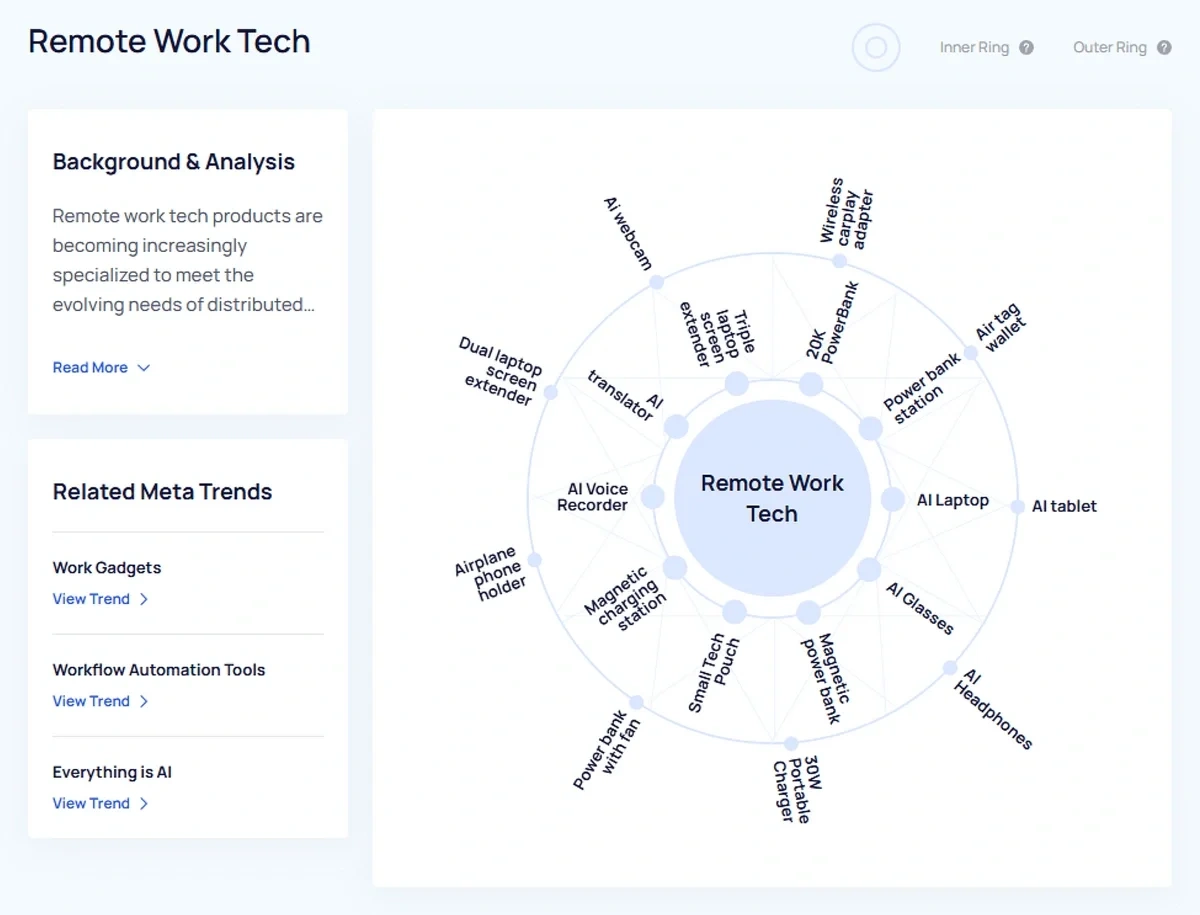
- Meta Trends: Discover underlying micro trends within a larger category for a deeper understanding of related topics, brands, and products. It gives you a convenient look into the core popular ideas powering a niche.
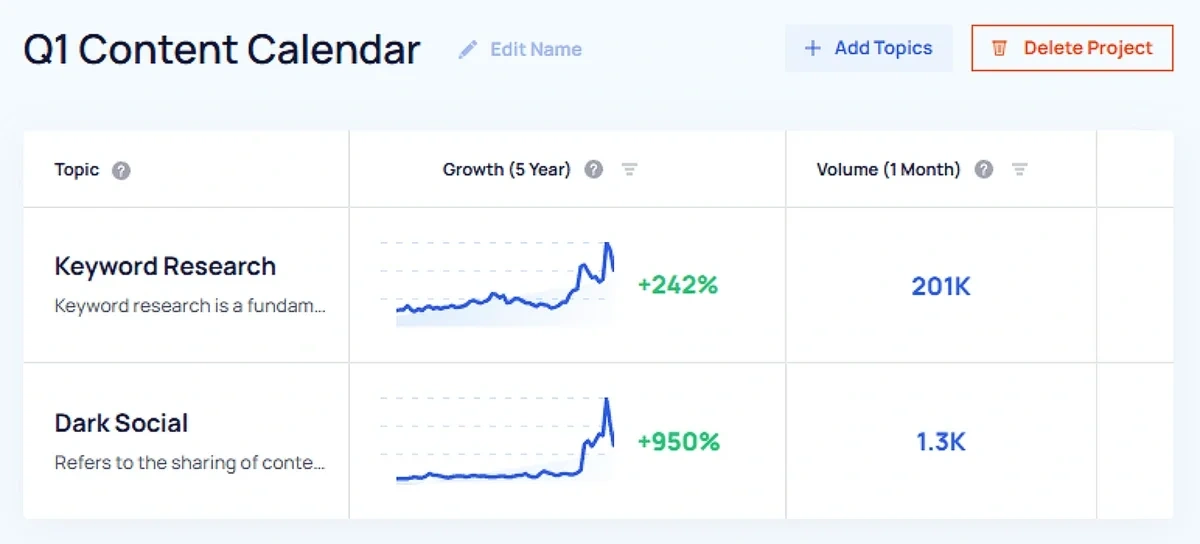
- Trend Tracking: A single dashboard where all your tracked trends appear. It’s great for monitoring trends that you are interested in without the distraction of other trends from the database you don’t need right now.
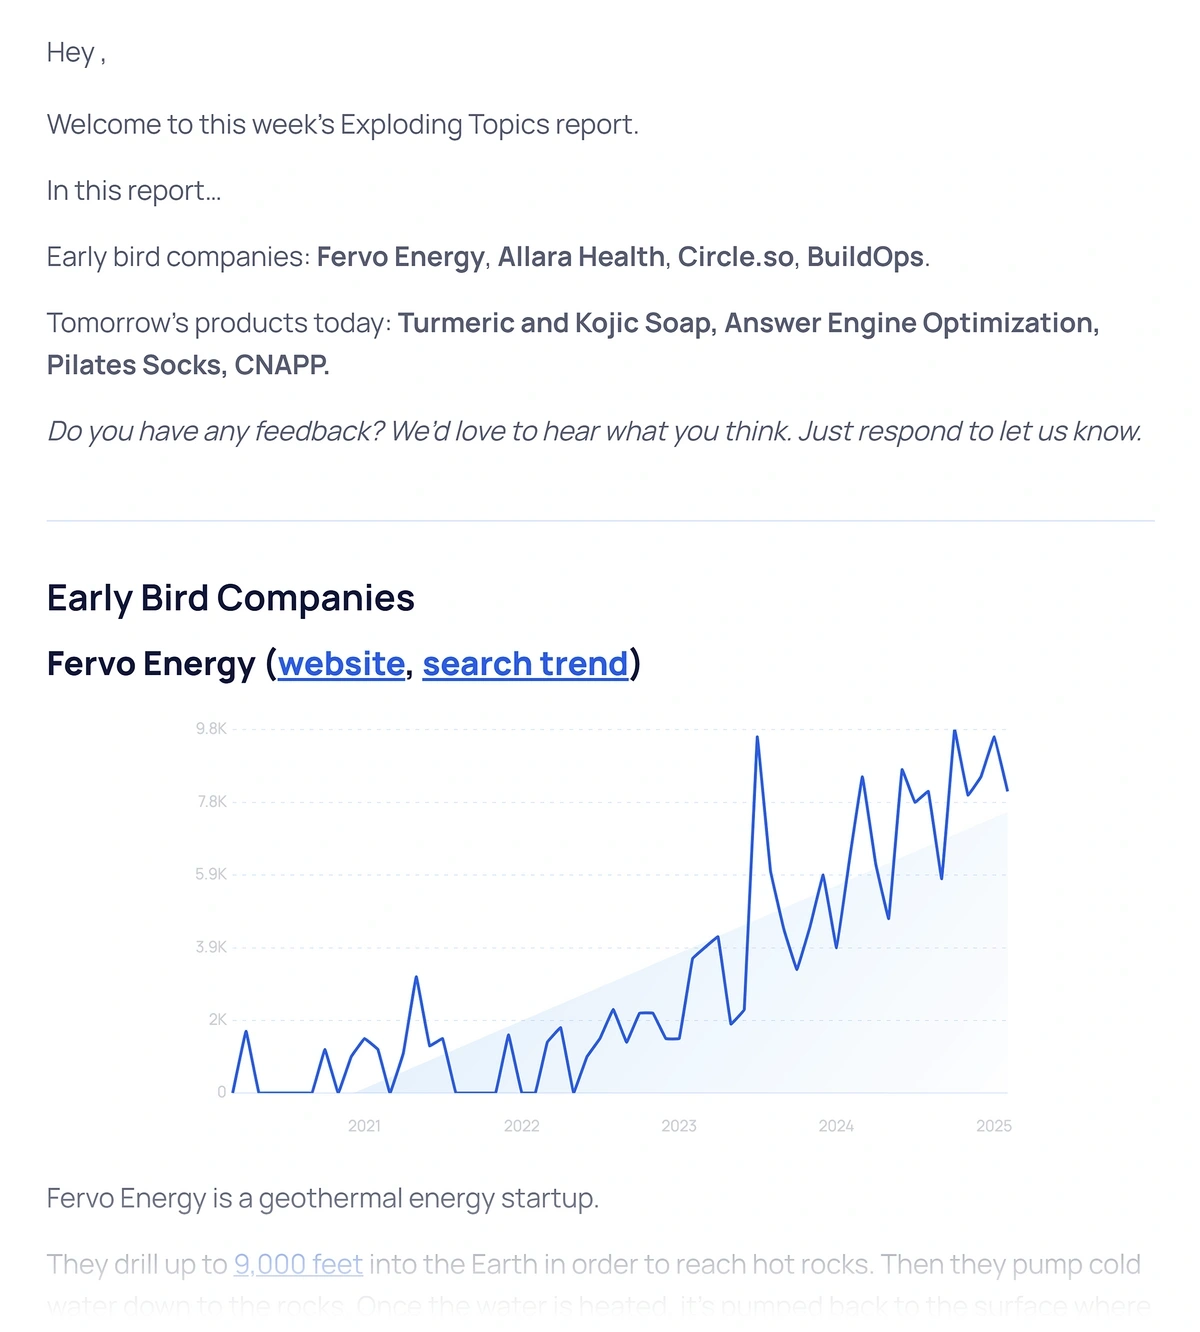
- Weekly Trend Reports: Every week, Exploding Topics publishes a trend report spotlighting rising companies and emerging products. The report analyzes factors influencing each trend as well as the likely course the trend will take in light of recent events.
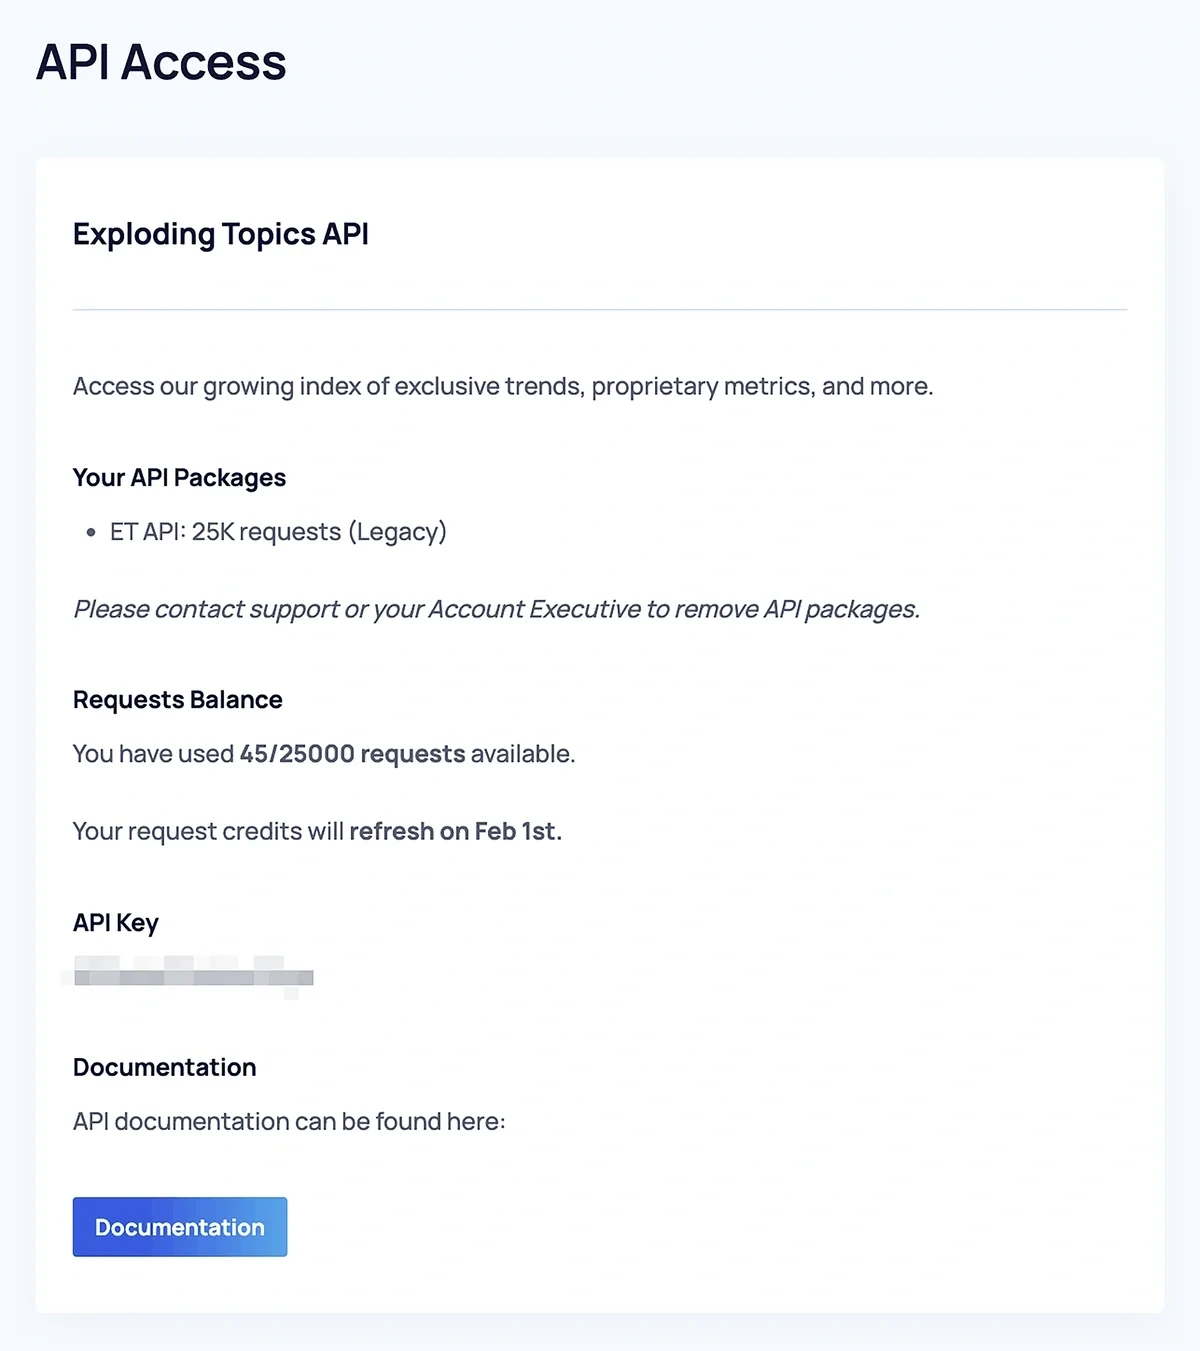
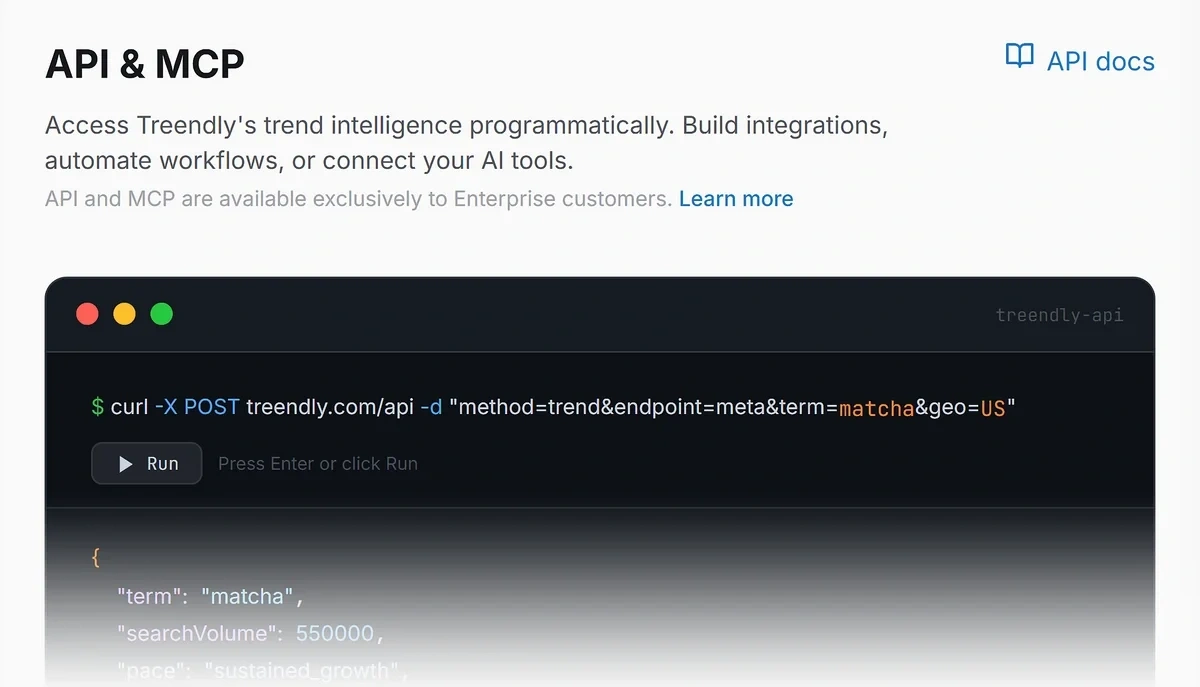
- Exploding Topics API: This API brings all the unique Exploding Topics data to your custom reports and dashboards. You get the full flexibility to pull only the most relevant trends meeting your exact filters and criteria, saving you the manual effort of sifting through the trend database.
Treendly
Treendly doesn’t offer much beyond its core offerings. But it has a couple of useful extras like:
- Treendly API:. The Treendly API lets you retrieve trend data for terms on a 1-year or 5-year timeline. The API serves geographically focused data too, which is a good feature to have for users interested in local trends.
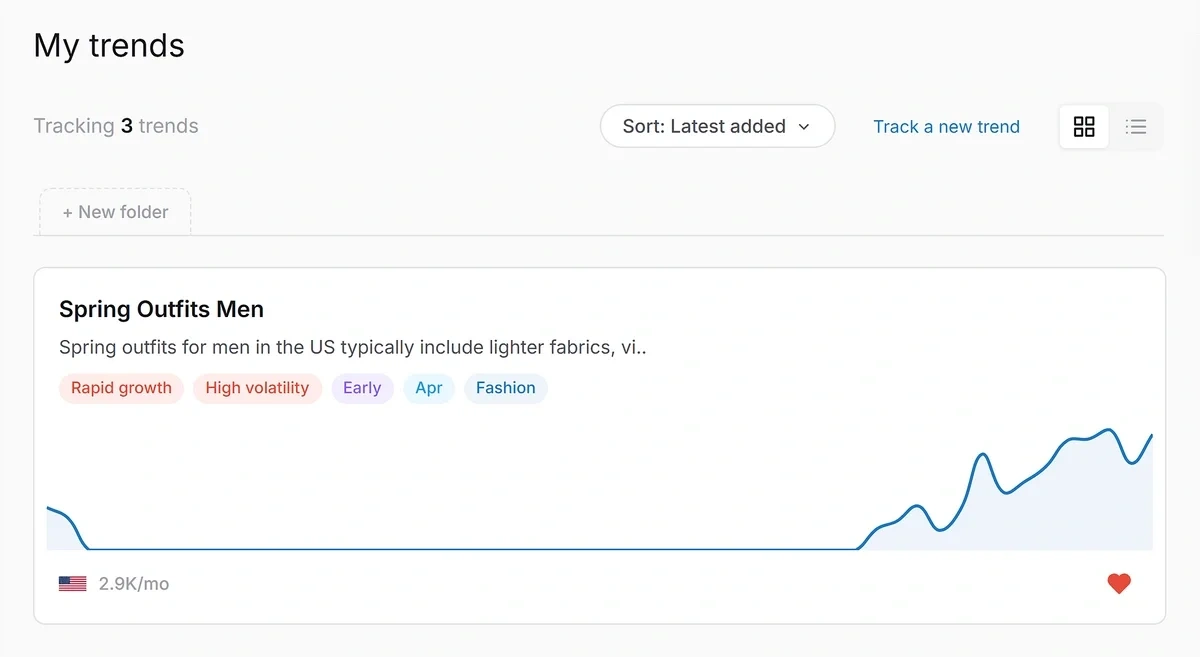
- Trend Tracking: Treendly lets you monitor trends in a dedicated dashboard. It displays a summary of the trend with a mini chart along with volume and trend data. You can set a tracking frequency of 1 week or 1 month to update the trend data.
Pricing
My verdict: Exploding Topics is the clear value play: plans start at $39 and scale to $249 with API access, so small teams aren’t priced out. Treendly jumping straight to $99 feels hard to justify with its smaller library and 25-trend cap. And you’ll pay even more (custom Enterprise) for API and unlimited limits.
Exploding Topics
Exploding Topics offers three pricing plans:
- Entrepreneur ($39/mo): Great for small businesses and marketing teams that need trend-based product research, keyword discovery, and content planning.
- Investor ($99/mo): Offers the best value for bigger teams and investing-focused professionals. It unlocks a higher limit for tracked trends and trend lookups.
- Business ($249/mo): Suited for large teams interested in maintaining a large database of tracked trends. You also get API access.

Exploding Topics offers more flexibility for teams of all budgets. Despite having one of the largest databases of regularly updated trends, it’s one of the most affordable options out there.
Treendly
Treendly’s paid plan starts at $99, which is a bit steep considering it has a significantly small trend library. It also has a tracking limit of up to 25 trends.
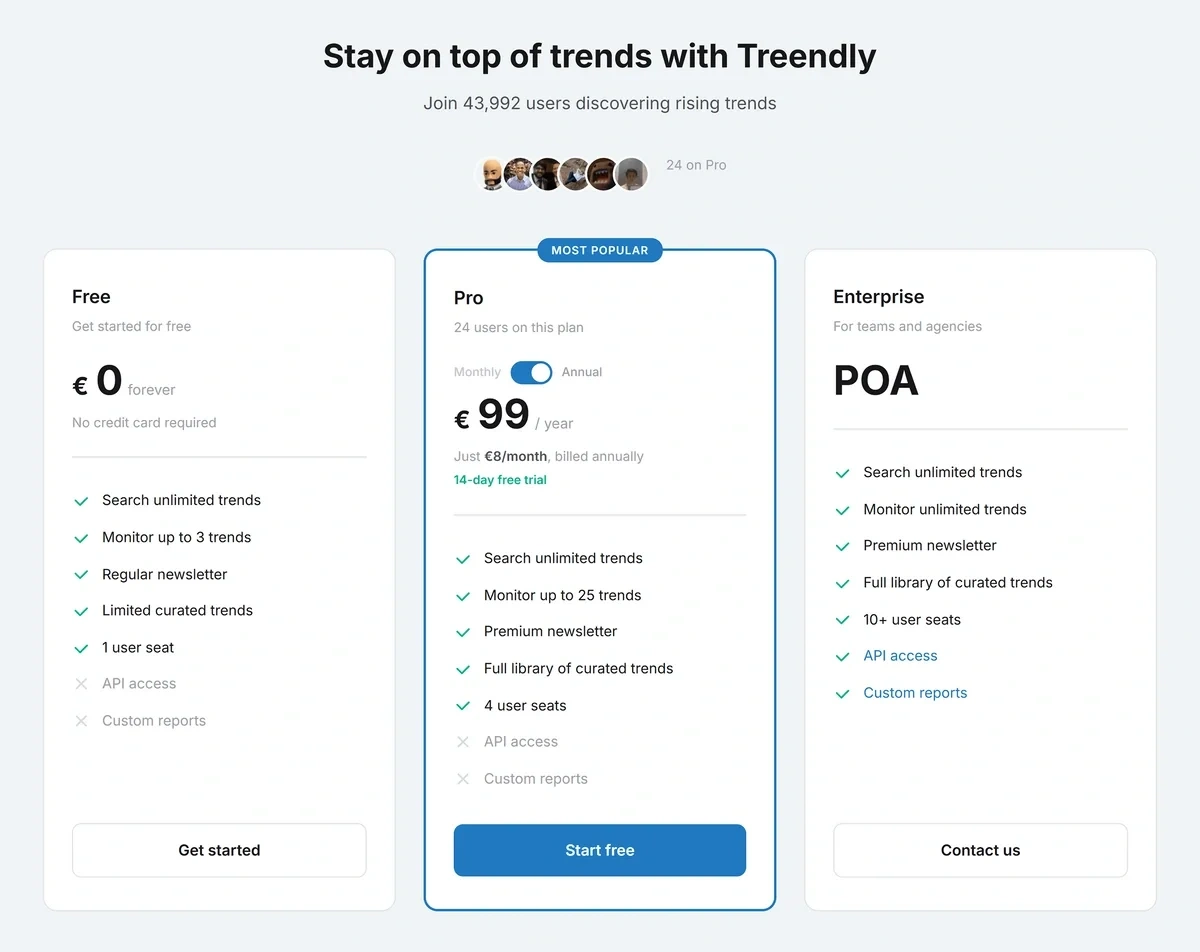
For API access and unlocking unlimited limits, you’ll need the Enterprise level plan, which only comes with customized pricing depending on your needs.
Compared to Exploding Topics, Treendly is a more expensive option with stricter limits.
Usability
My verdict: Exploding Topics is the one I’d actually enjoy using day-to-day: clean sidebar navigation, focused category browsing, responsive search, great charts (including the channel spider graph), and a slick TikTok Insights dashboard. This is all fast and smooth. I appreciate Treendly’s clean design and the growth tags are nice, but the slower load times are quite frustrating if you’re a regular user.
Exploding Topics
Exploding Topics is a simple software without a learning curve. Once you’re logged in, all the tool's features are accessible from the left sidebar for navigation.
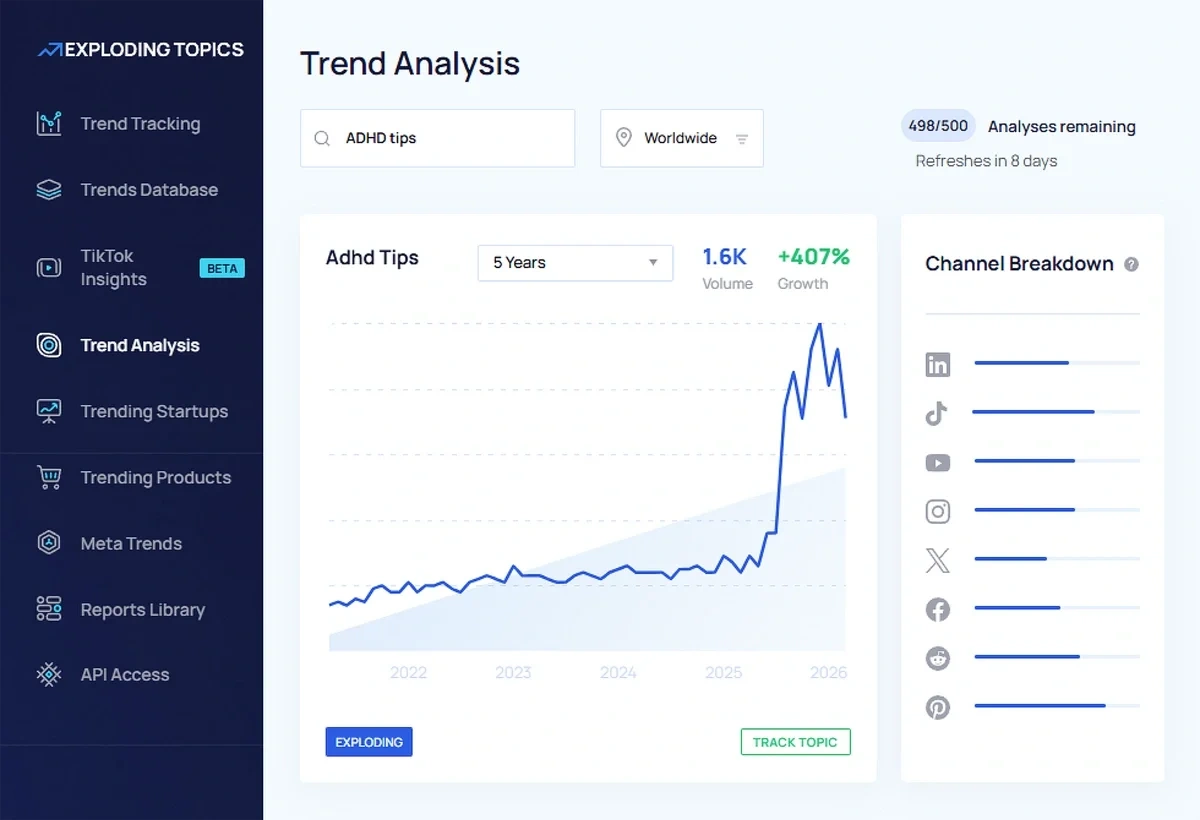
And all the reports have a user-centric design with an intuitive structure.
For example, the categorized view in the Trends Database is a design choice that I really appreciate because it encourages focused exploration.
Instead of displaying random trends, the database lets you select the most relevant niche for searching trends.
And if you just want to start with a keyword, you can type it in the search box. The app will dynamically show the most closely matching trend results as you type.
I’m a big fan of the charts and the quality of visualizations.
The interactive search volume data points on the x-axis allow you to see how searches are changing month-over-month for your topic.
It’s really easy to understand channel breakdown as well with the spider graph.

The main TikTok Insights add-on dashboard is a pleasure to use. You get simple activity charts to see what growth looks like for a TikTok trend quickly.
The TikTok thumbnail videos are also a nice touch. The entire dashboard is visually appealing and not cluttered with excessive data.
Finally, Exploding Topics is fast. Trends load up quickly, and moving from one report to another is super smooth.
Treendly
Treendly follows a simple design approach to keep things easy and quick for users.
The dashboard displays your tracked trends in one column and a bunch of recommended trends in the other column.
That’s everything you can expect from your homepage screen: just the bare essentials and a few essential metrics.
The trends pages present the topics with their growth charts for all categories at once. You can narrow down your search by using the category filter.
Treendly adds a rapid growth or sustained growth tag to trends that exhibit certain growth patterns. It’s a pretty neat feature for aiding your search for strong trends.
My only major gripe with Treendly in terms of usability is the slow loading speed. It takes an average of 7-10 seconds to load any page or report inside the app.
Even if you just want to apply a filter on a trend page, it can take up to 10 seconds for the page to refresh with the applied filter.
Exploding Topics vs Treendly: Choosing the Best Trend Spotting Tool
Exploding Topics stands out because it combines search trend data with additional insights that inform how strong a trend really is.
If you’re doing keyword research, it’s great for identifying topics with rising searches and related content ideas.
It’s one of the best sources of product research, especially for dropshippers and established e-commerce stores.
With the TikTok Insights add-on, sellers have even more market-validated data to take action.
Exploding Topics is also useful for investors who need information about a company’s current search trend and funding to evaluate investment opportunities.
Most importantly, Exploding Topics pricing starts lower than Treendly.
For the Pro plan, both apps are priced the same.
But you get more value with Exploding Topics: a significantly bigger trend database, deeper insights and data filters, and higher tracking limits.
Start your trend analysis with an Exploding Topics free trial today.
Stop Guessing, Start Growing 🚀
Use real-time topic data to create content that resonates and brings results.
Exploding Topics is owned by Semrush. Our mission is to provide accurate data and expert insights on emerging trends. Unless otherwise noted, this page’s content was written by either an employee or a paid contractor of Semrush Inc.
Share
Newsletter Signup
By clicking “Subscribe” you agree to Semrush Privacy Policy and consent to Semrush using your contact data for newsletter purposes
Written By


Osama is an experienced writer and SEO strategist at Exploding Topics. He brings over 8 years of digital marketing experience, spe... Read more