


Get Advanced Insights on Any Topic
Discover Trends 12+ Months Before Everyone Else
How We Find Trends Before They Take Off
Exploding Topics’ advanced algorithm monitors millions of unstructured data points to spot trends early on.

Keyword Research
Performance Tracking
Competitor Intelligence
Fix Your Site’s SEO Issues in 30 Seconds
Find technical issues blocking search visibility. Get prioritized, actionable fixes in seconds.
Powered by data from
Latest Blog Posts
Featured Case Studies
See what's trending before everyone else
Each week, we'll send you our best Exploding Topics. Plus, expert insight and analysis.
Top 5 Treendly Alternatives I Recommend for 2026

Treendly is a trend-detection tool that lets you explore topics, companies, and products rising in popularity.
It’s a budget-friendly tool that covers the basics quite well.
You can find search volume for trending ideas and obtain context behind the growth of trending ideas.
That said, Treendly isn’t without its limitations. Despite its effectiveness, there are several Treendly alternatives on the market that offer valuable trend discovery features.
1. Google Trends
Google Trends is the most obvious Treendly alternative.
I’m putting it at the top of this list because it’s the only truly free trend-spotting tool out there, and it’s the inspiration behind most other tools in this space.
Since it’s Google, the database of trends is absolutely massive. You can find trend data for pretty much any topic under the sun.
The catch, however, is that the tool is most useful when you already know the search term you want to analyze.
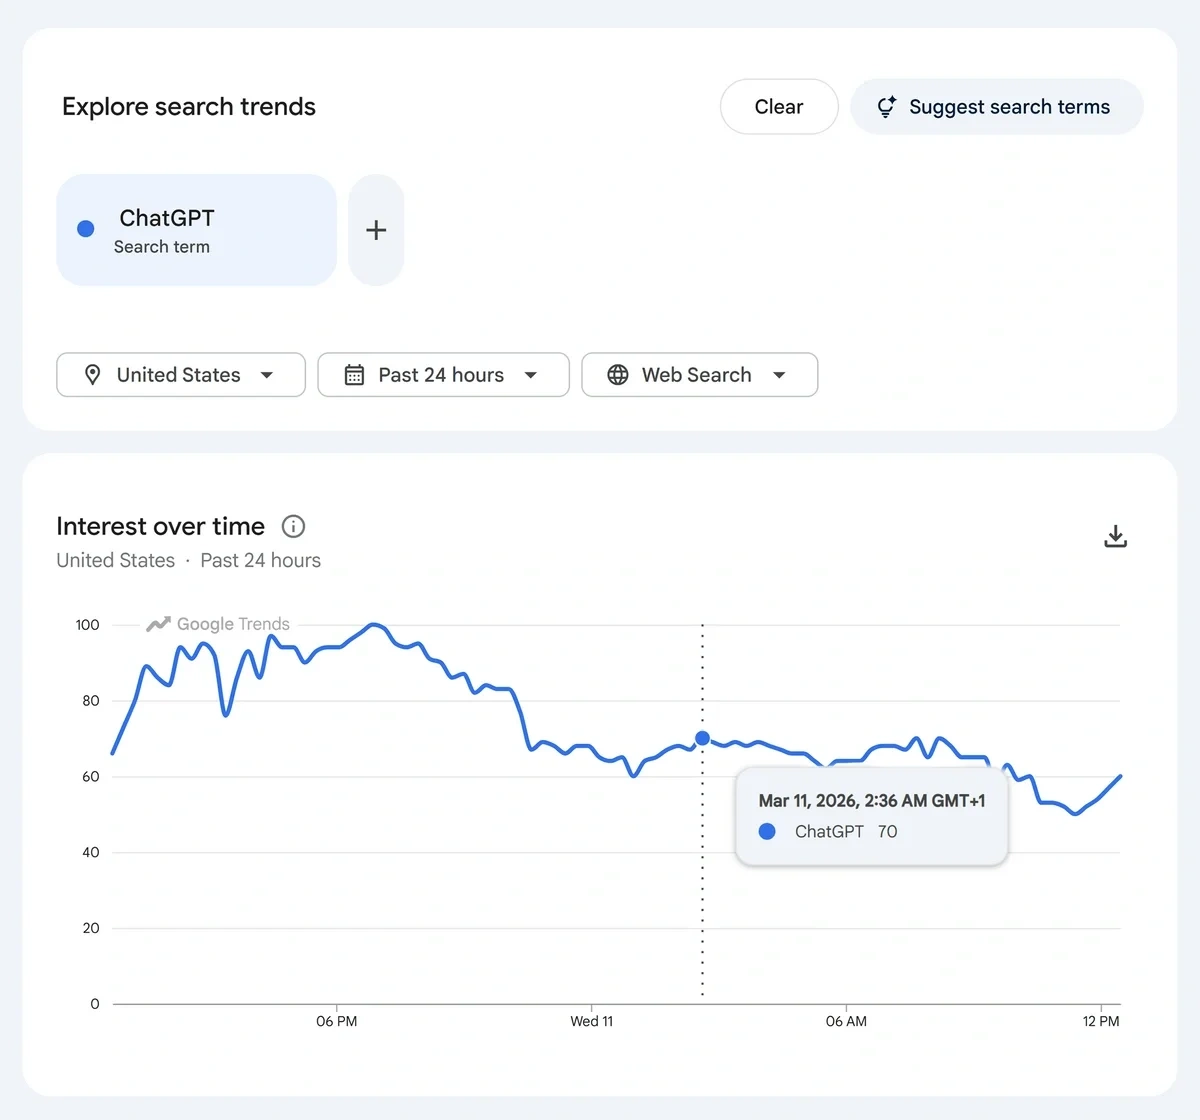
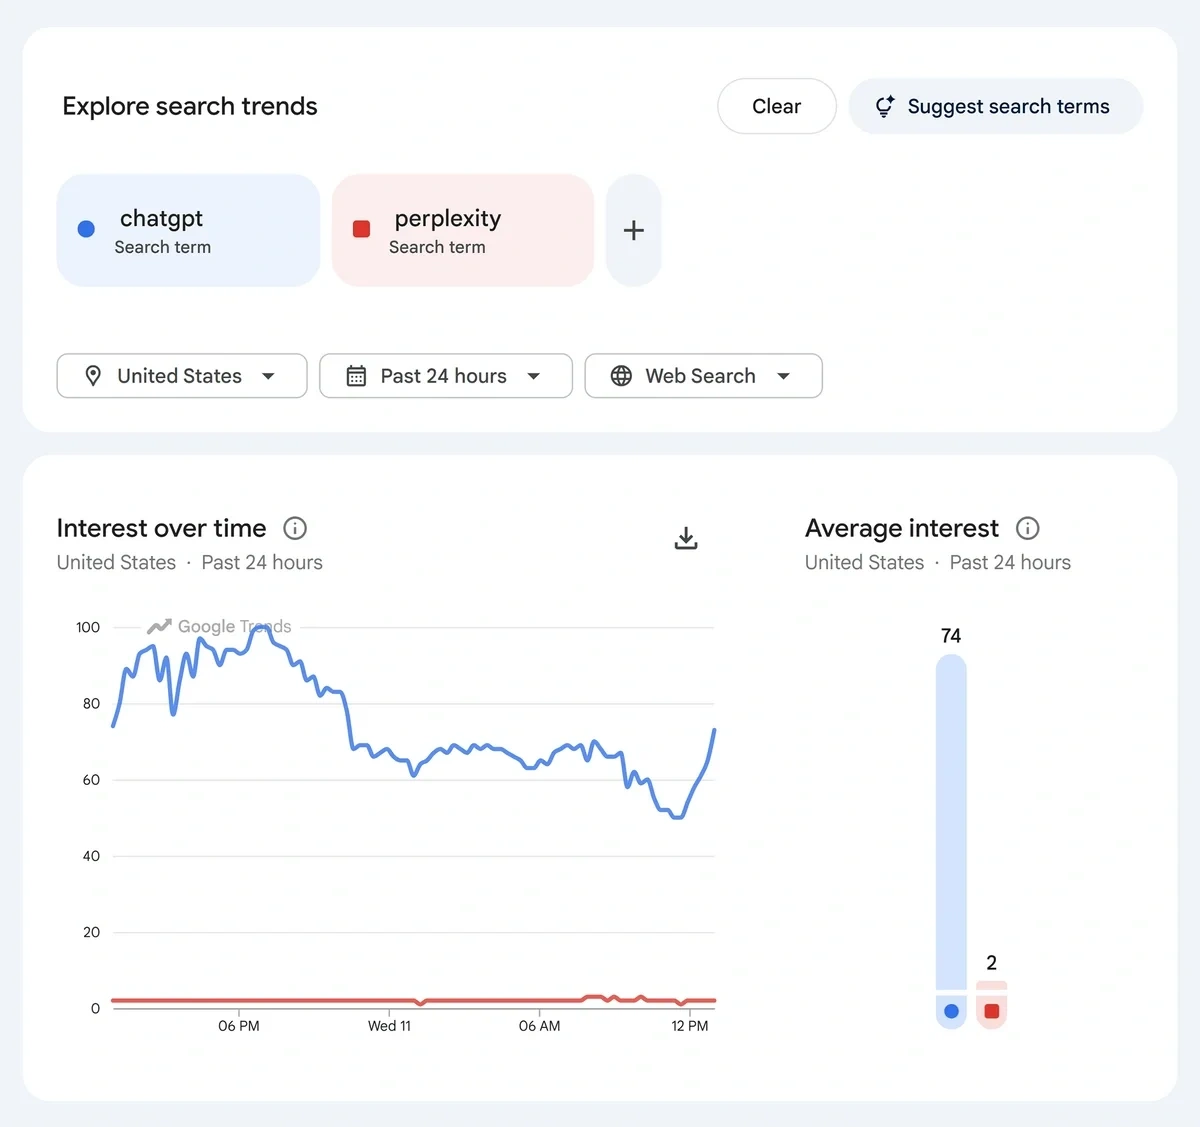
The tool shows you the interest in your topic on a scale of 0-100, indicating its relative popularity.
And as you can expect from Google, you have the largest selection of locations to analyze your trend in.
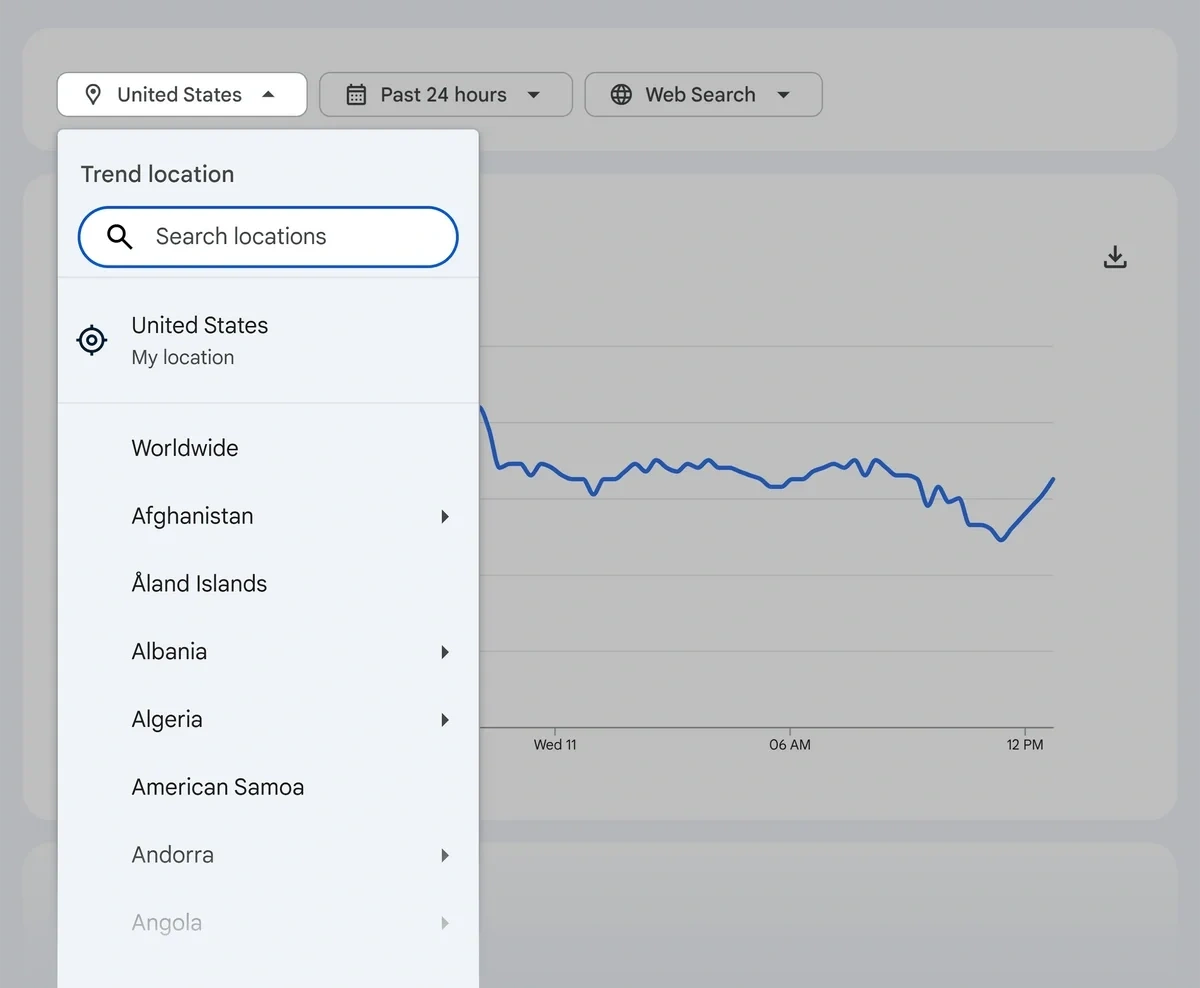
The timeframe filter goes as far back as 2004 as well, which is more than what you can get in any other tool.
Besides, you’re not just limited to web search. You can also analyze search trend data for:
- YouTube search
- Google Shopping
- News Search
- Image Search
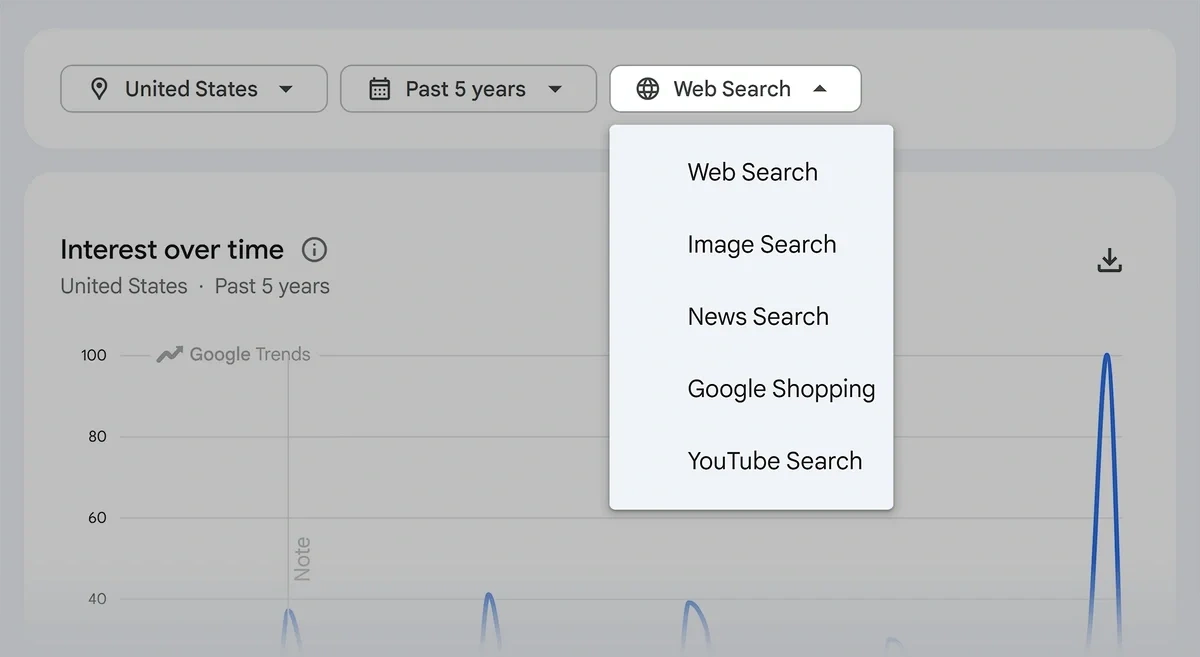
These are all powerful advantages that you won’t find in Treendly or most other tools on the market.
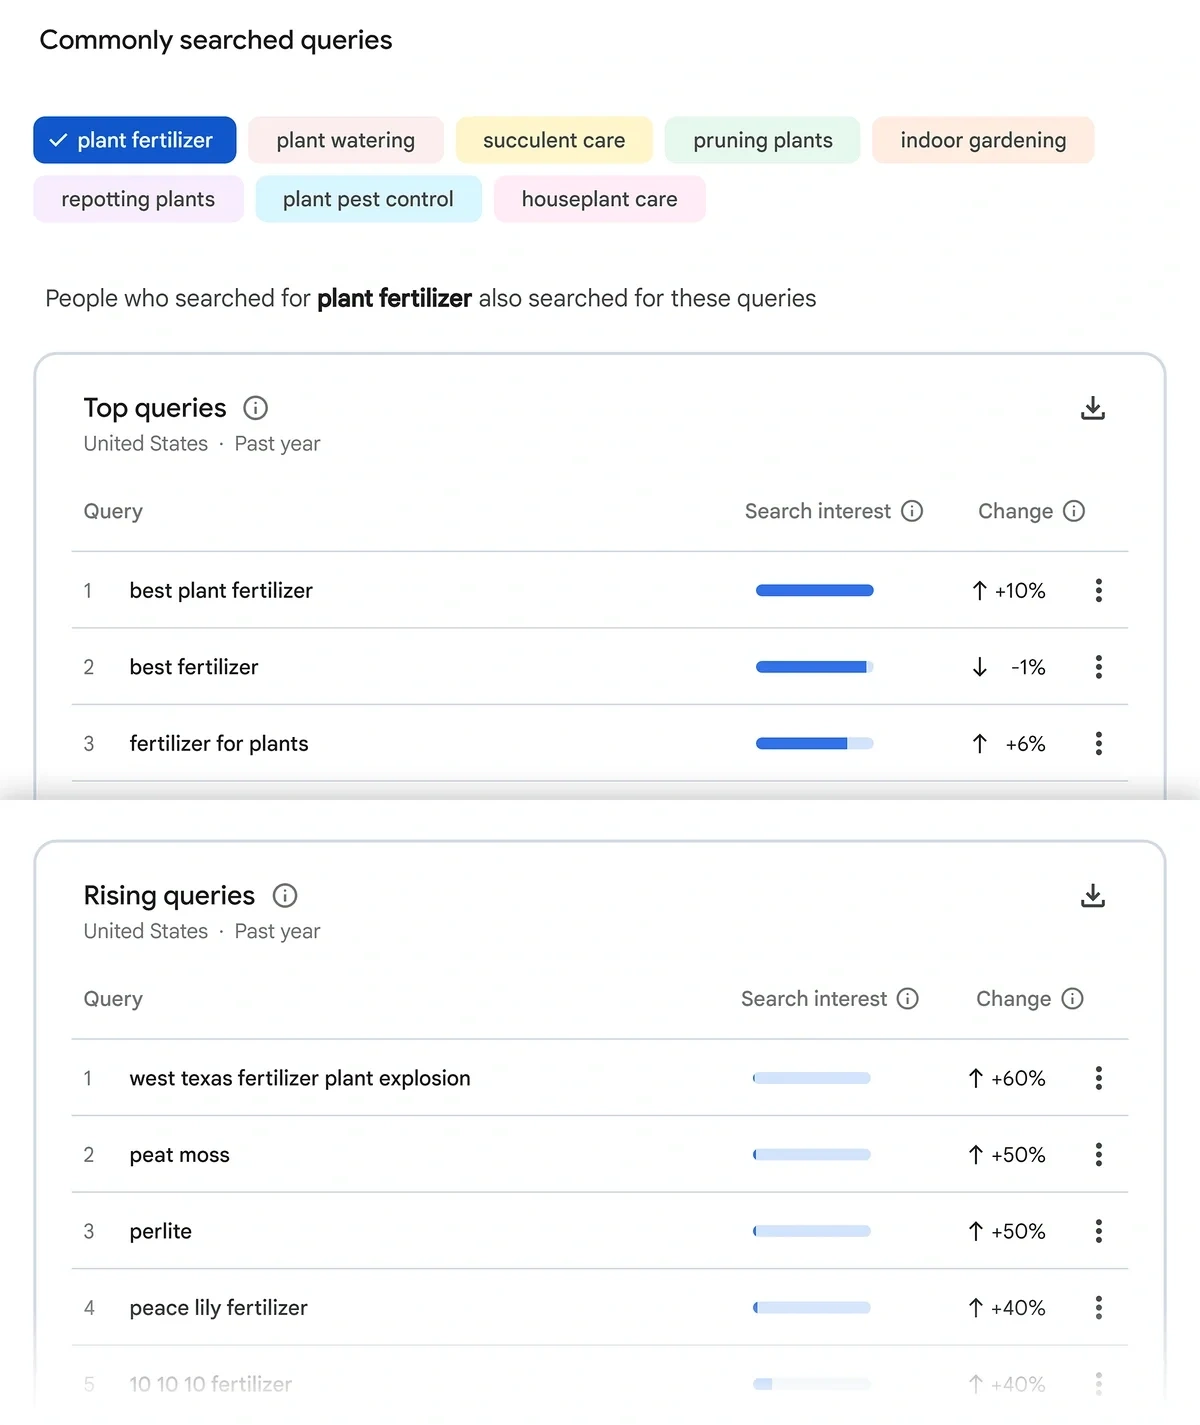
For every search term, Google Trends also shows you two tables giving you additional data related to your search term: Top Queries and Rising Queries.
These are quite useful for understanding the related ideas and concepts that the audience of your primary topic interest is also searching for.
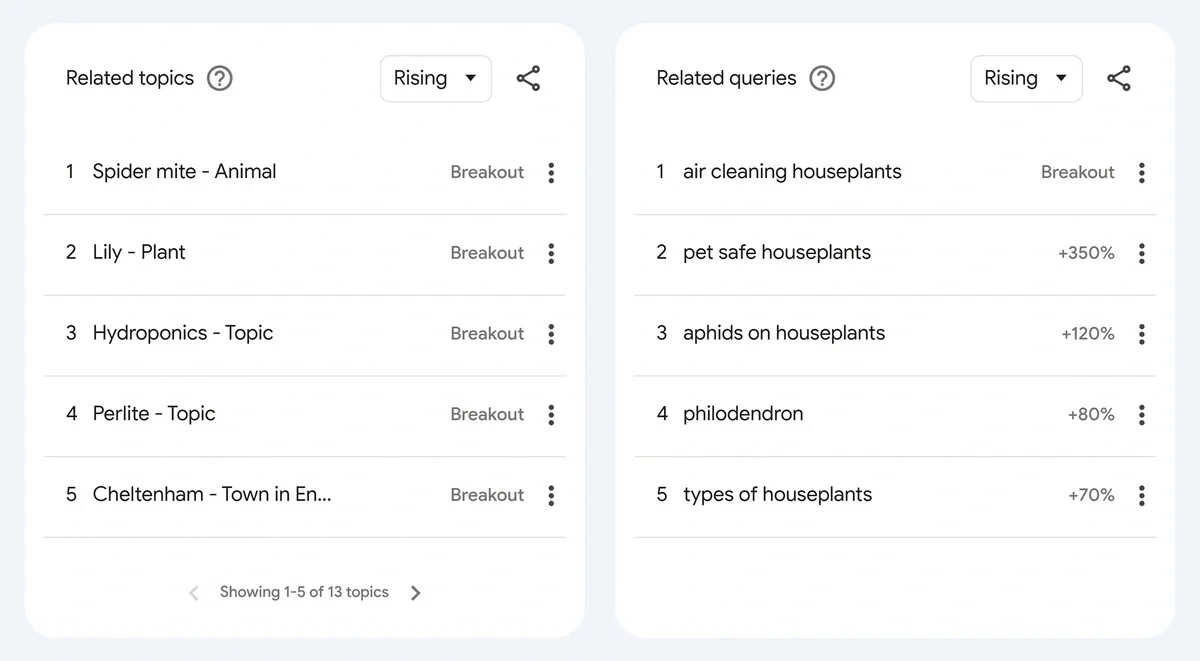
You can discover keyword clusters, content ideas around a central theme, audience pain points, and even product ideas with this data.
If you need to compare multiple search terms, you can simply press the ‘+’ icon to type your next term.
Google Trends will display overlapping charts for each trend so you can conveniently analyze them on the same screen.
The new version of Google Trends also has Gemini integrated into it.
This feature automatically generates search terms based on your area of interest. This is super handy, especially if you don’t already know what keywords you’re looking for.
You can simply describe a rough idea, and Gemini will translate your prompt into real search terms that you can then analyze.
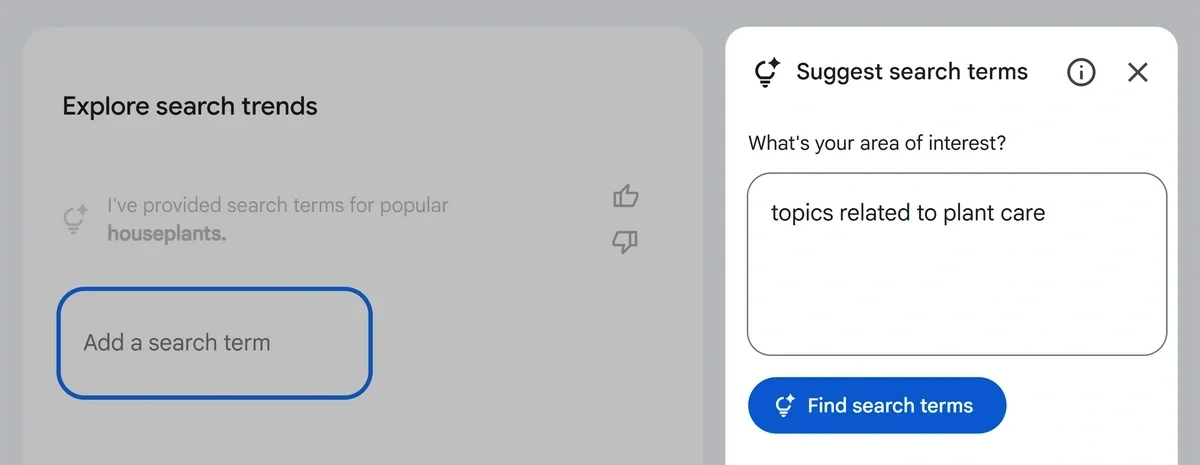
In addition, it generates a bunch of additional related suggestions that you can click to reveal different bundles of search terms to be analyzed.
When you’re evaluating multiple queries, Google Trends creates tabs for each query so you can drill down into related searches in the table for each.
These are important features that improve your trend discovery process in ways in which Treendly is often lacking.
That said, if you’re starting from a place of ignorance and just want to explore a database of trending topics in your niche, Treendly is the better option since it’s designed with that workflow in mind.
Further reading: See how you can use Google Trends for your e-commerce growth strategy
2. Exploding Topics
As a trend detection tool, Exploding Topics goes further than Google Trends and Treendly in several ways.
In fact, Treendly’s main features are very similar to Exploding Topics when it first launched.
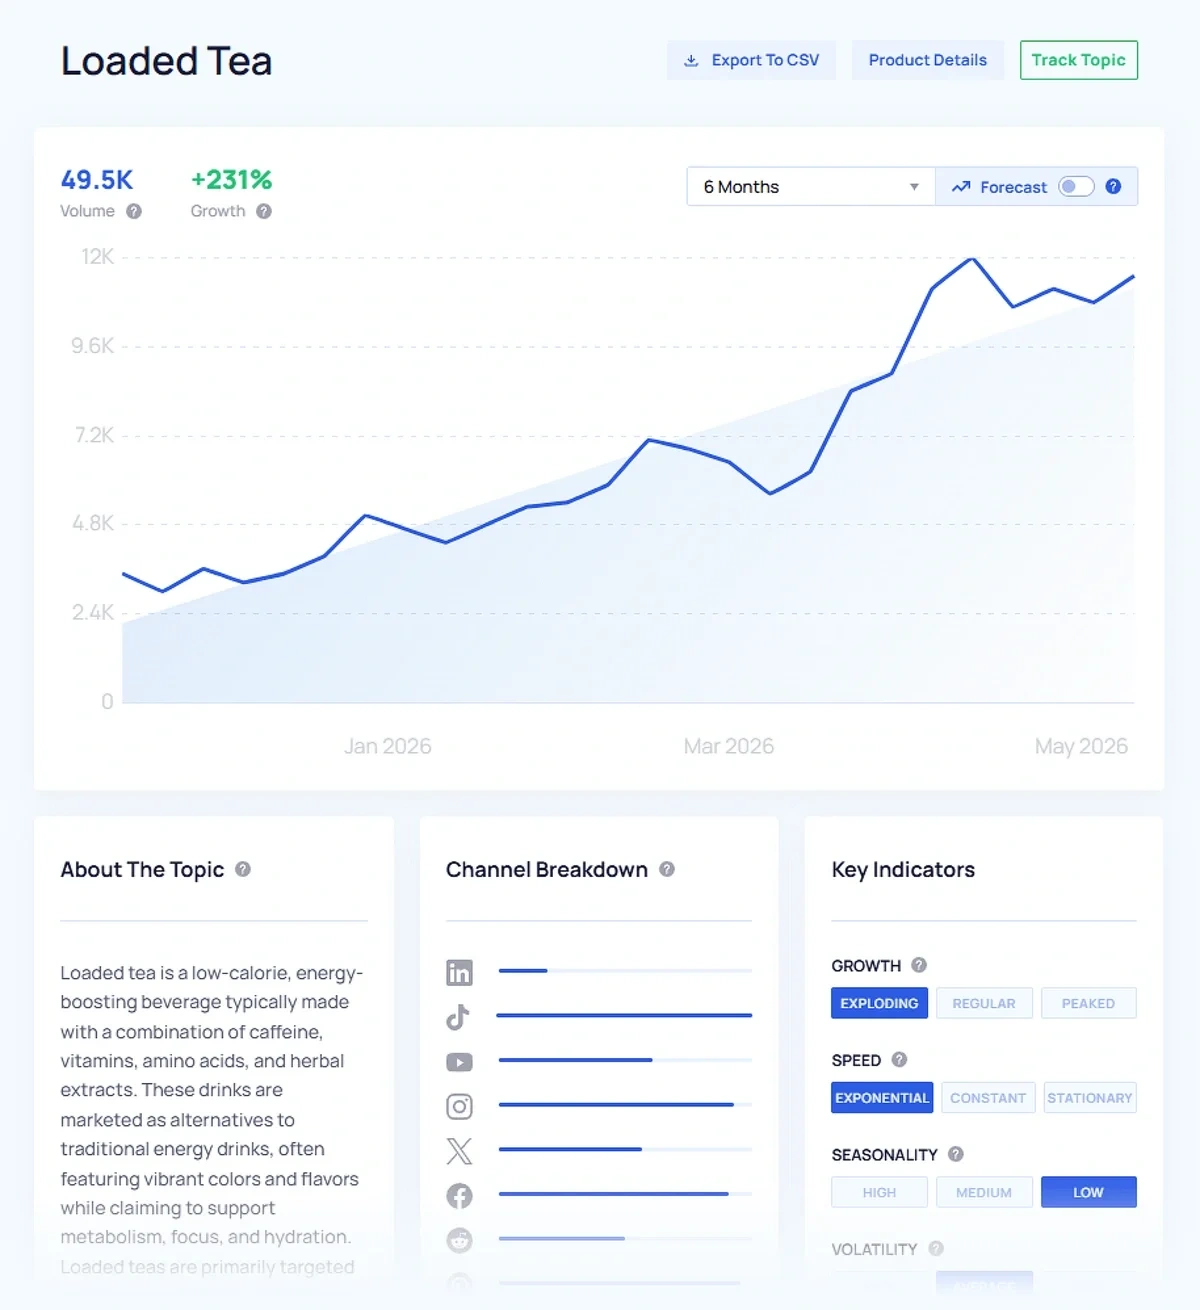
The core feature is the Trends Database. This is where you can discover all kinds of trends: topics, products, and companies organized into over a dozen categories.
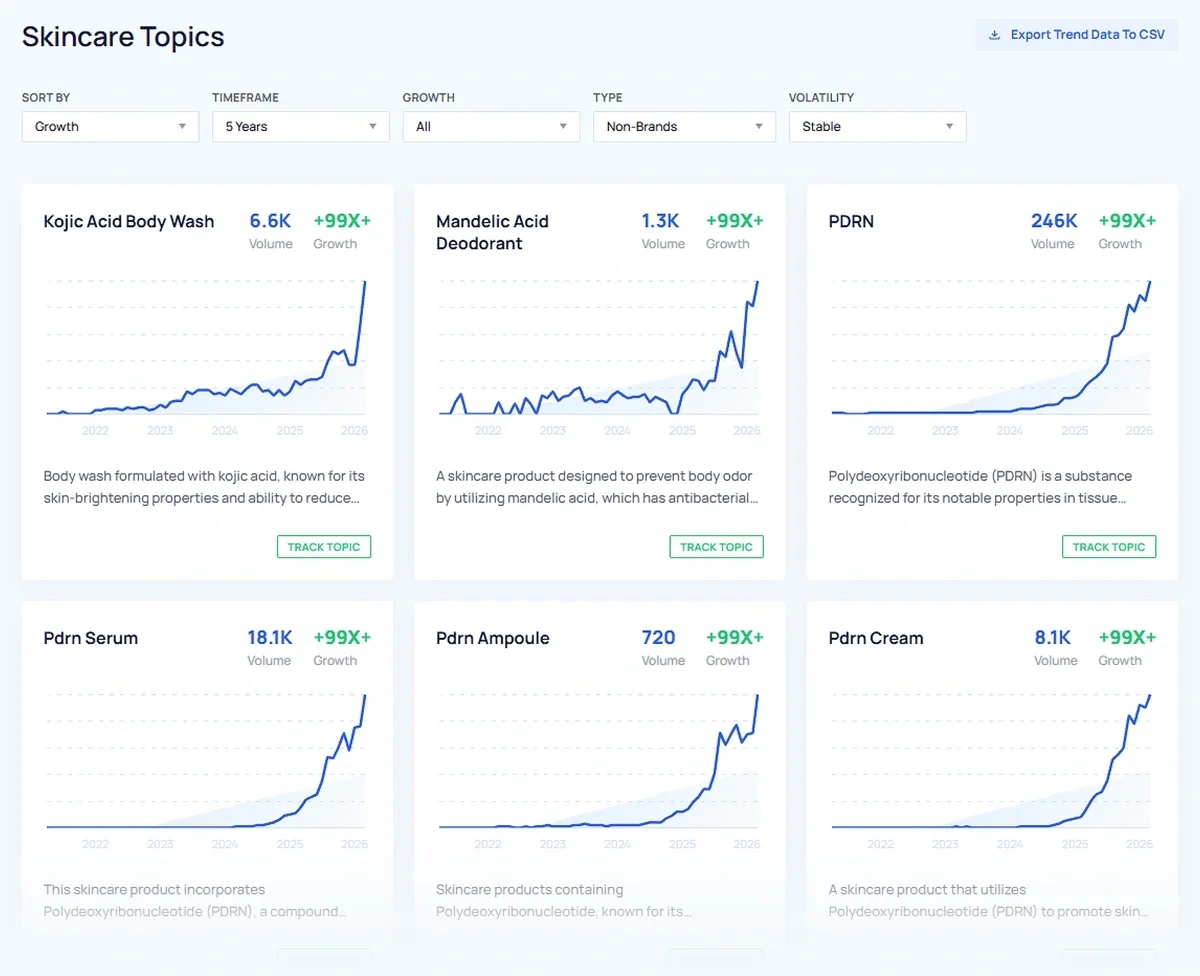
You have flexible filtering options to narrow down your trend exploration. The filters for growth patterns and volatility allow you to focus on trends meeting specific trend characteristics.
And the analysis timeframe goes back as far as 15 years if you want to see how a trend has grown over the long term.
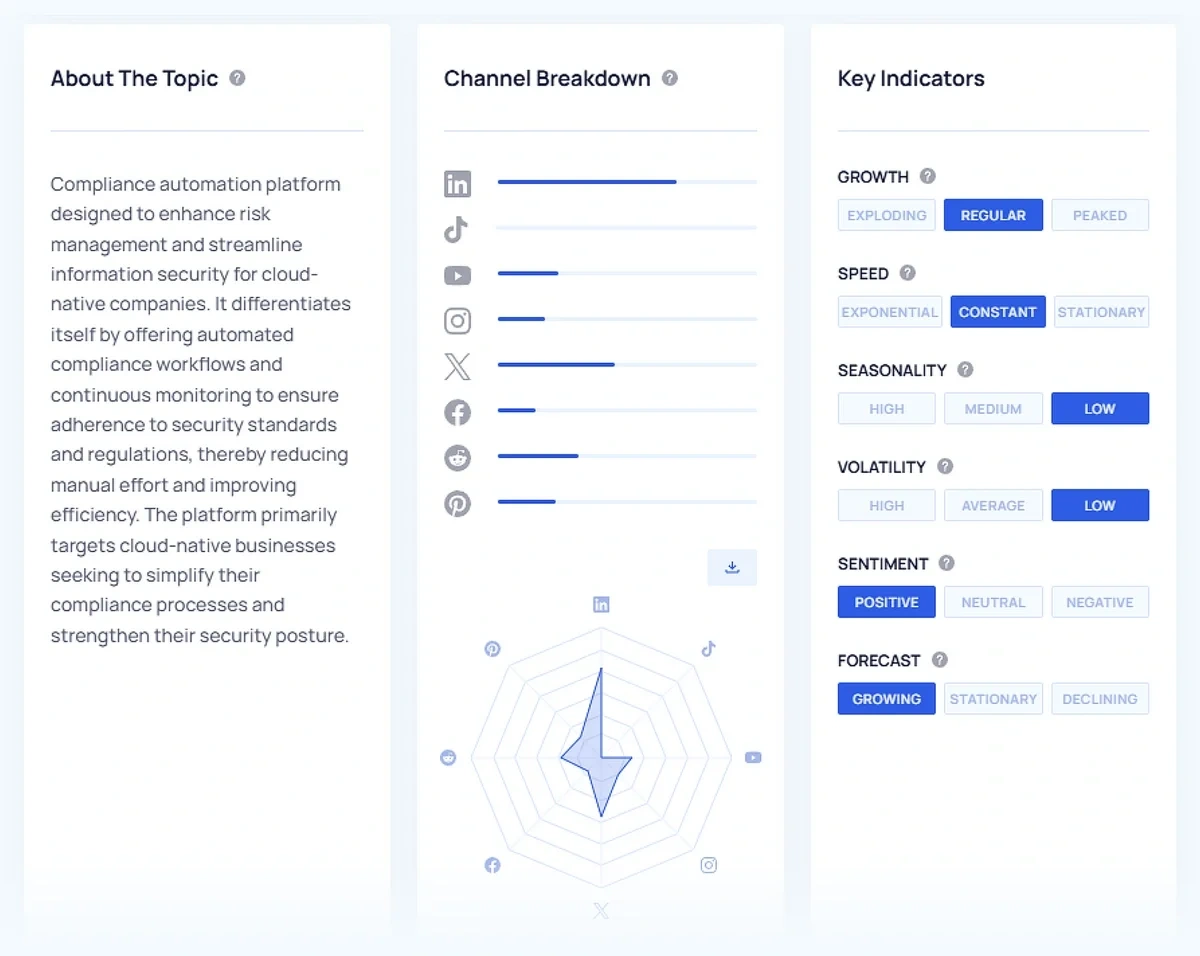
Unlike Google Trends, Exploding Topics also has dedicated pages explaining the context and background for each trend.
Additionally, it measures the behavior of the trend and lists the important characteristics under the Key Indicators section.
With Treendly, you don’t get a channel breakdown for a trend’s activity levels on social media.
That’s one of the several areas where Exploding Topics has an edge. I'll explain more below, and you can also read my comprehensive Exploding Topics vs Treendly breakdown.
Social media plays a huge role in shaping trends. Without that intel, your trend analysis will always be incomplete.
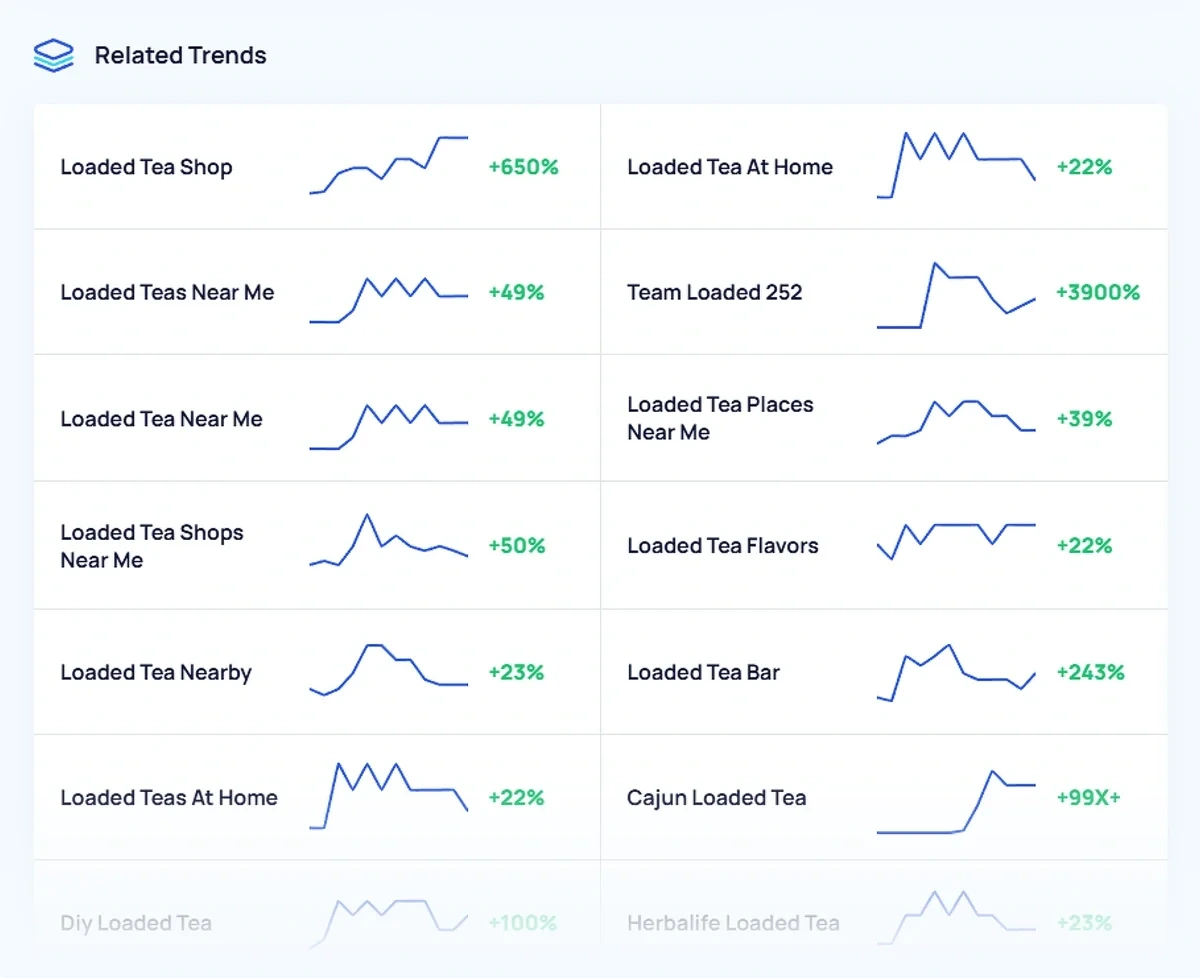
Exploding Topics gathers a ton of data for trends related to the main topic you’re exploring.
This shows you a mini trend chart along with the growth percent.
While Treendly and Google Trends also show you related queries, they don’t give you exact growth metrics.
That makes it a bit challenging to interpret demand and interest around the related sub-queries.
There’s a separate database for Trending Products that tracks search volume and growth data, along with a bunch of other e-commerce metrics.
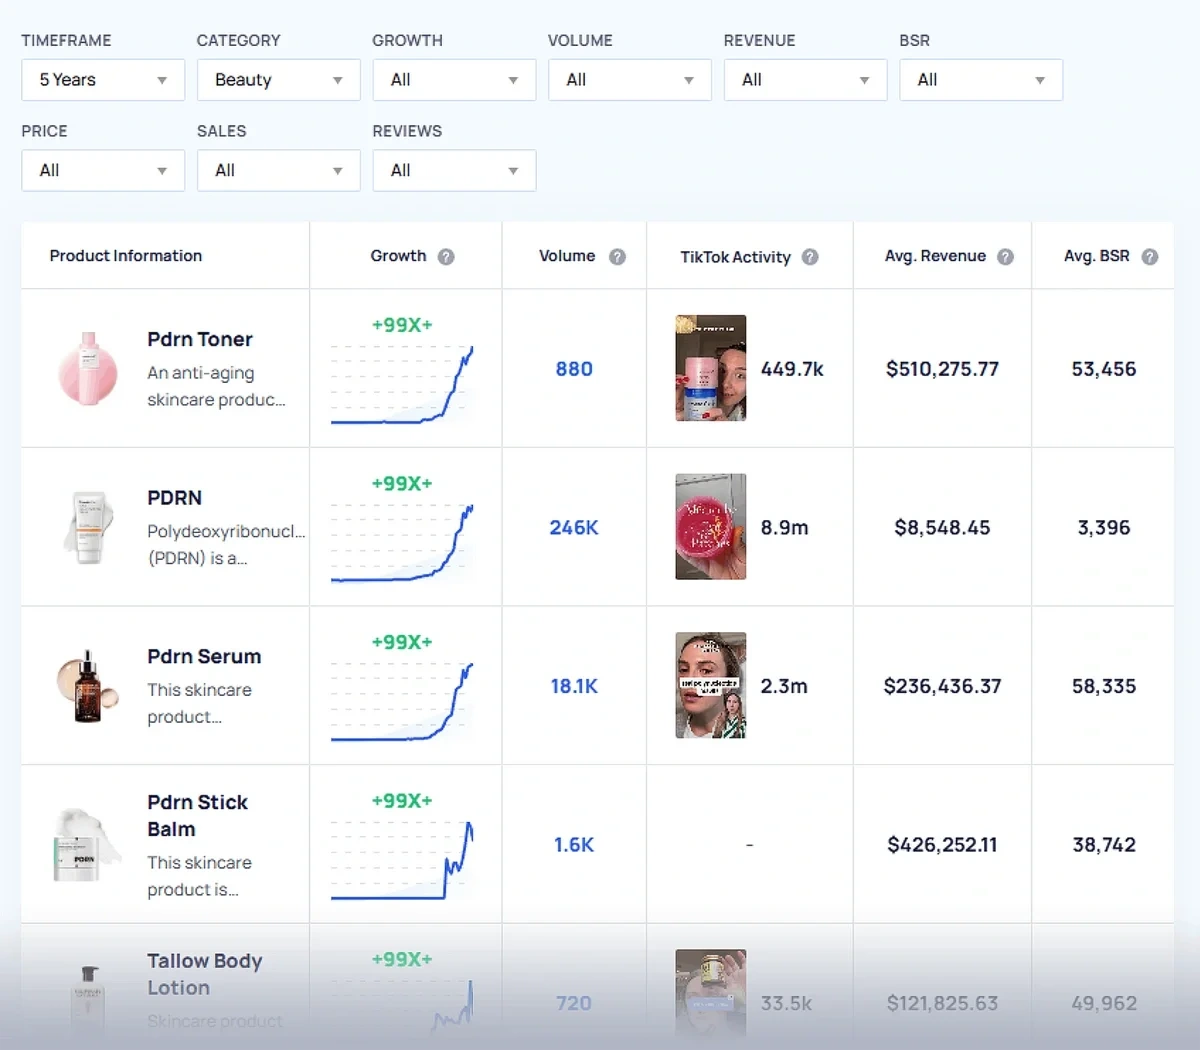
The breadth of data here sets Exploding Topics apart from alternatives like Treendly and Google Trends.
Instead of looking at only search volume, the tool gives you useful figures like average revenue, sales, price, and reviews. A huge convenience for e-commerce teams that regularly need to perform competitive product analysis.
Exploding Topics pulls most of these details from Amazon.
But if you have the TikTok Insights add-on, you’ll get additional data from TikTok, such as activity levels for product-focused content.
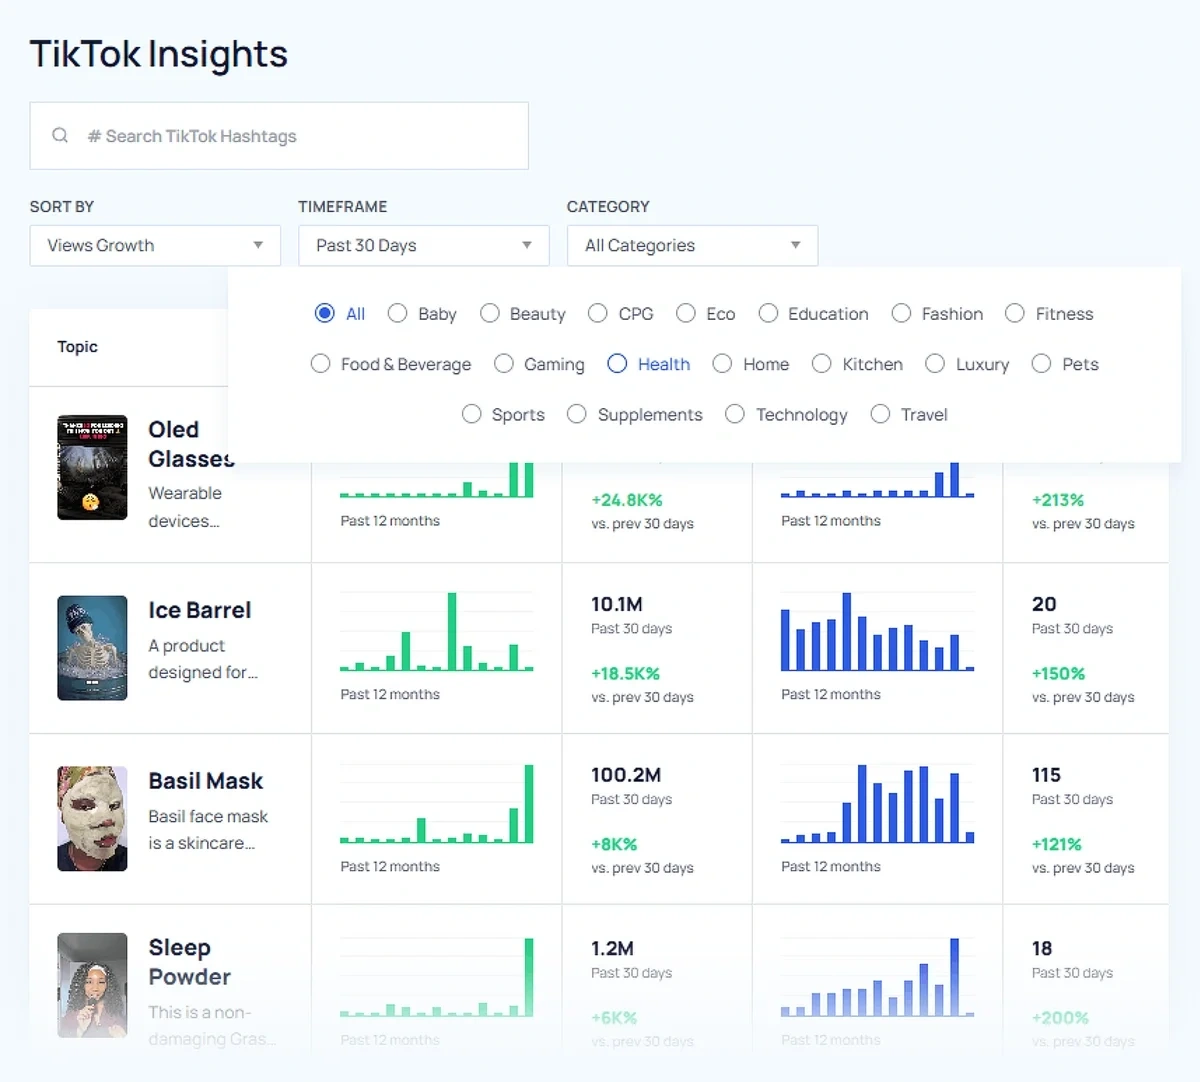
Exploding Topics goes into much greater depth than its main alternatives when it comes to product trends.
For every product, Exploding Topics offers these insights, organized into 5 separate tabs:
- Key Metrics: Includes channel breakdown, key indicators, search volume, and growth
- TikTok Insights: Highlights recent TikTok posts, likes, and views related to the product
- Top Sellers: Displays seller, brand, and sales information from Amazon
- Related Products: Suggests similar products also trending
- Related Trends: Shows topics and search terms related to the product
It’s super useful data that you can pipe into your inventory planning processes as well.
While Treendly itself offers some interesting and useful insights for helping companies make better decisions about trending products, Exploding Topics has a definite edge here.
Additionally, the tool includes a database for trending startups.
Once again, you’ll find a decent amount of contextual information for startup funding and company size in addition to data about their search trends.
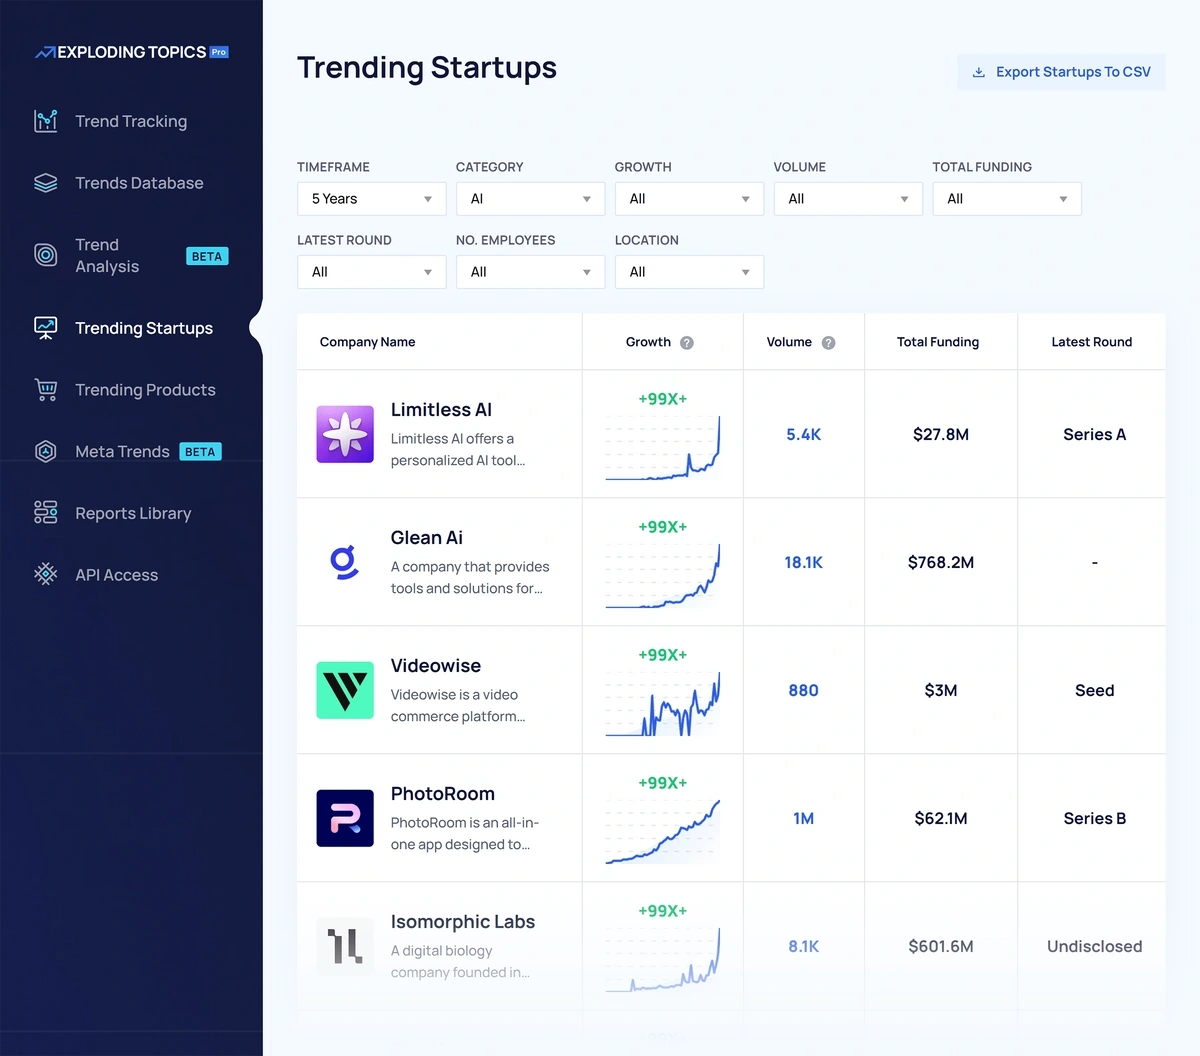
Every startup page also contains details such as key indicators, channel breakdown, related startups, and trends.
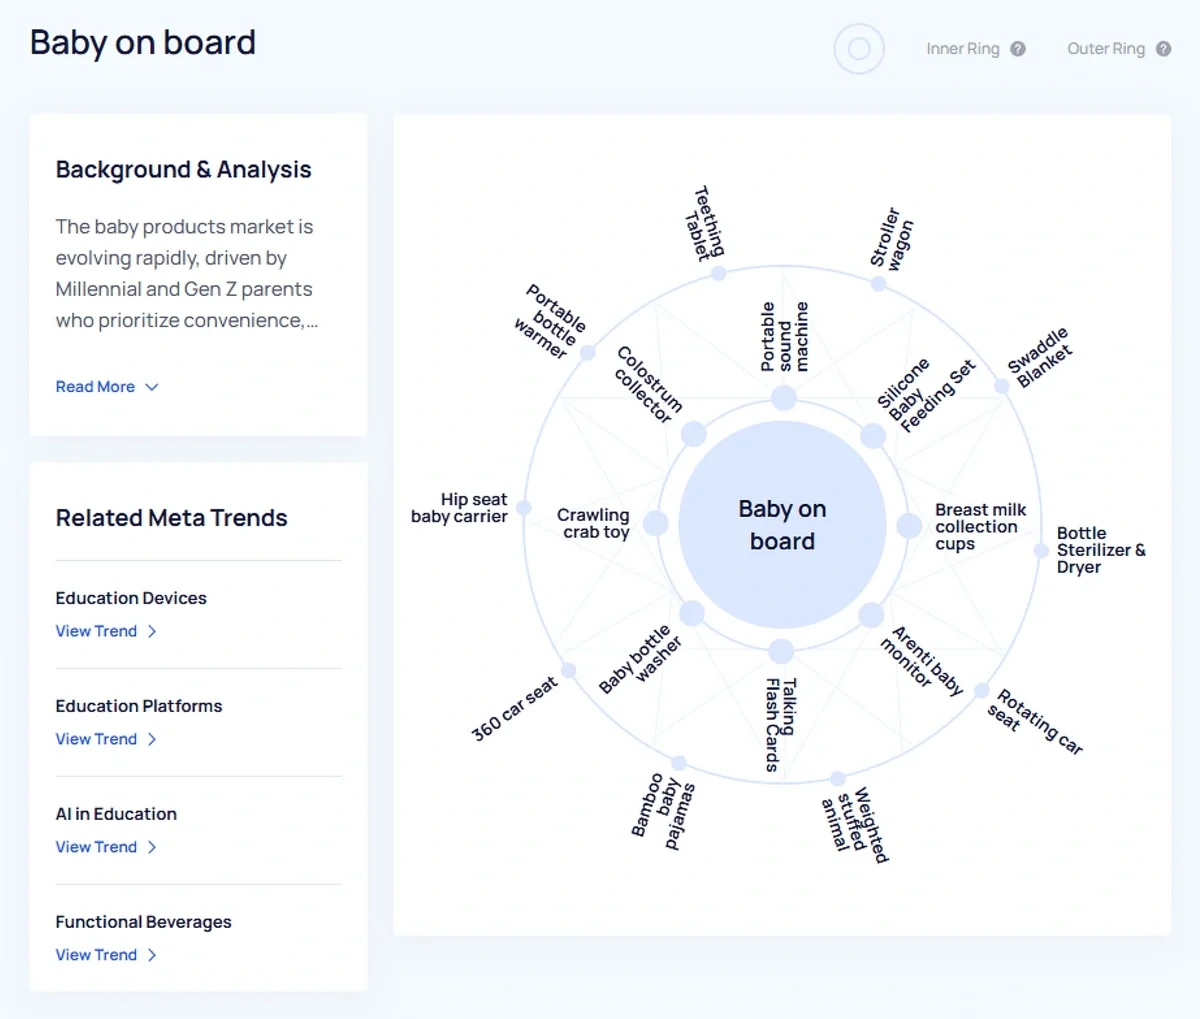
Meta Trends is another important feature that reveals the themes around a major trend.
Finding specific trends in a niche is great.
But many trends are connected to several other concepts shaping a single larger pattern.
Meta Trends in Exploding Topics show you how a broad topic is connected with multiple smaller related ideas.
The visualization is intuitive and conveniently interactive. You can click on any trend represented in the ring chart to see its search volume and trend line immediately.
Treendly new offers a similar feature, called “Collections”. I think it’s one of the best features Treendly has that puts it in fair competition with Exploding Topics.
Finally, the Exploding Topics API is perfect for advanced use cases, especially at the enterprise team level.
It comes with several endpoints that allow you to retrieve topics, products, or companies from the database.
The API can be configured with a variety of parameters, so you’re pulling only the topics that meet your specifications.
Here’s a guide where I’ve shown how you can automate trend detection using the Exploding Topics API.
How much does Exploding Topics cost?
Exploding Topics starts at $39/month. The TikTok Insights add-on costs $59/mo in addition to the base price. You can also start a free trial to test the platform out before buying.
3. Glimpse
Glimpse is a tool that works on top of Google Trends. Essentially, it enhances Google Trends data in many ways.
Most importantly, it lets you discover trends by exploring popular topics in a category, a feature that Google Trends still lacks.
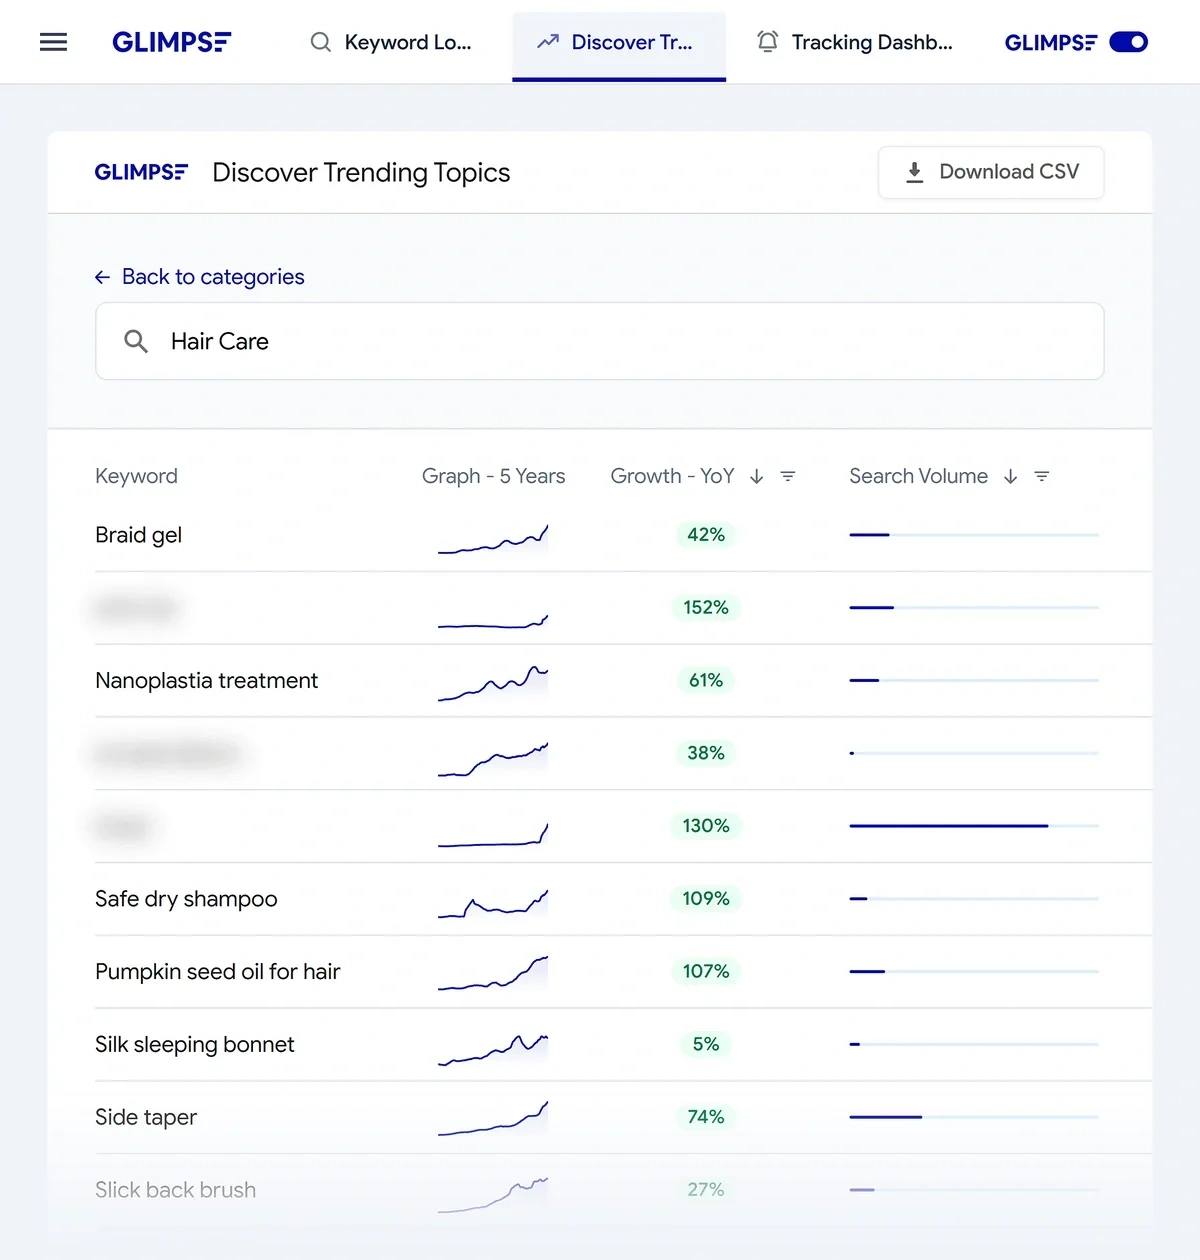
When you’re exploring a category, Glimpse shows you a table with a list of keywords, their trend graph, growth, and search volume.
The search volume is displayed as a bar without any numerical figures.
That makes it a bit tricky to know what the exact volume is until you click the trend and go to a page with additional details.
See how Exploding Topics compares to Glimpse.
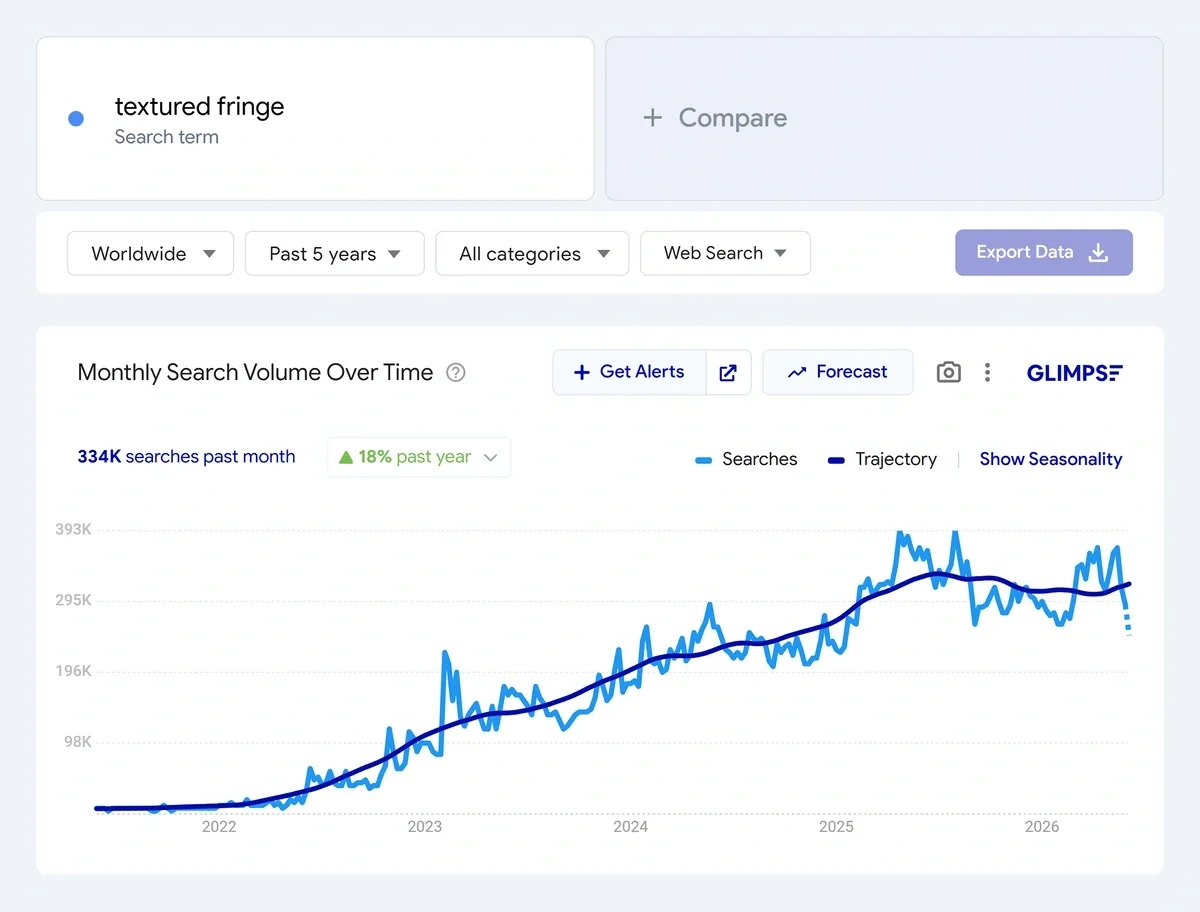
The interface is very similar to Google Trends when looking up a trend.
You get the same familiar filters for selecting location, timeframe, and search platform.
But Glimpse shines in the enhanced details it adds on top of Google data.
You get a search volume for the last month, along with a graph tracing search volumes over your selected time period.
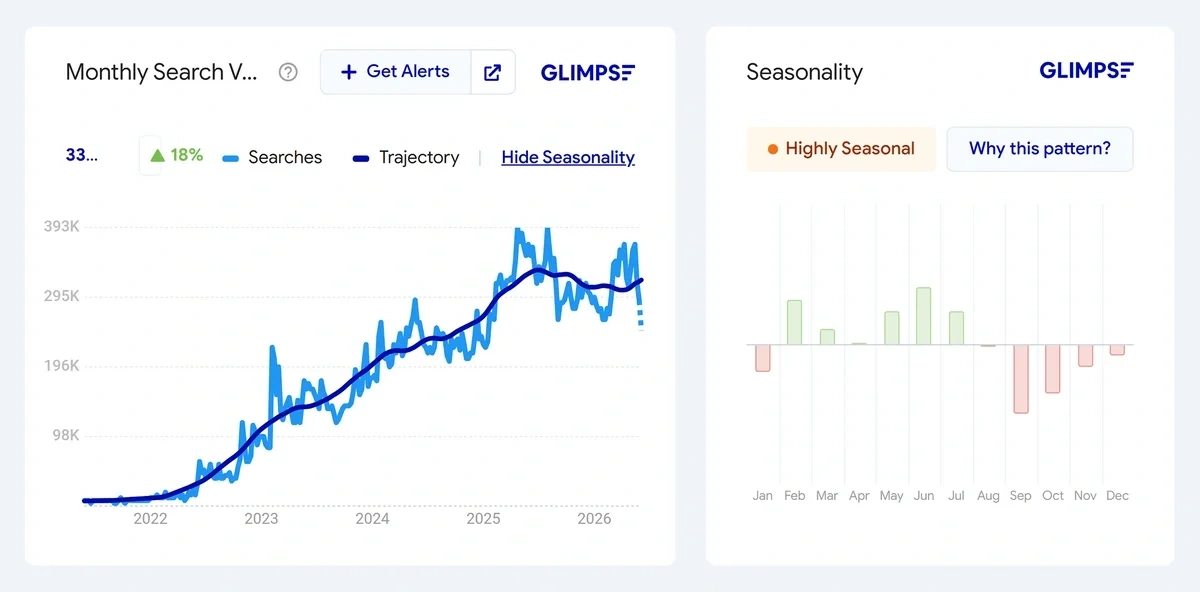
Glimpse also has the best seasonality analysis that I’ve come across out of all the tools I’ve tested.
It displays seasonality in a separate chart, which makes the analysis much easier. The seasonality pattern is also clearly labeled, so you know what the chart is representing.
It’s also a nice touch that you can get an actual summary describing why a trend is seasonal.
Apart from the trend chart, Glimpse also gathers other keywords that people interested in a given trend are also searching for.
What stood out to me is that you can find People Also Search data from multiple channels, including:
- Amazon
- YouTube
- TikTok
- Walmart
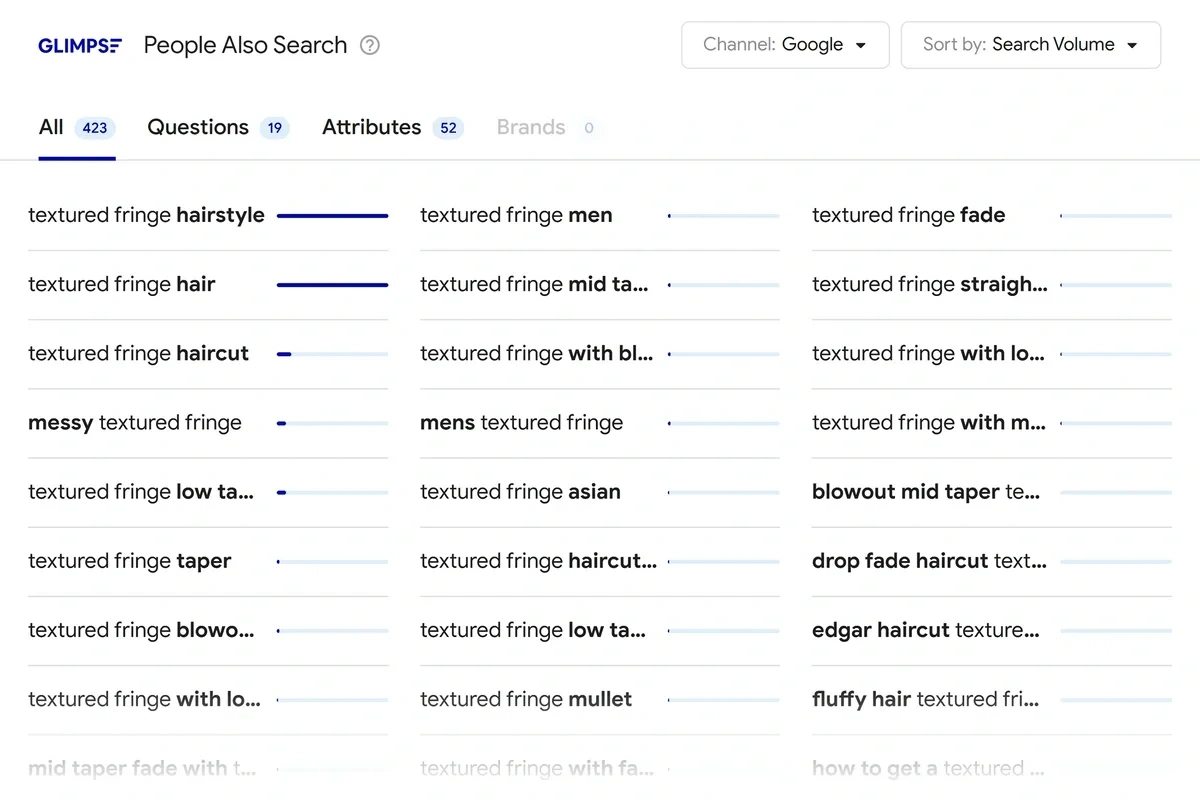
It’s a powerful feature that lets you explore search terms for different use cases.
For example, you can explore search terms in Amazon or Walmart for product research, YouTube for video content ideas, TikTok for social media inspiration, and so on.
Next, Glimpse also shows you related trends. These are the trends that are similar to the main trend but represent separate topics of their own.
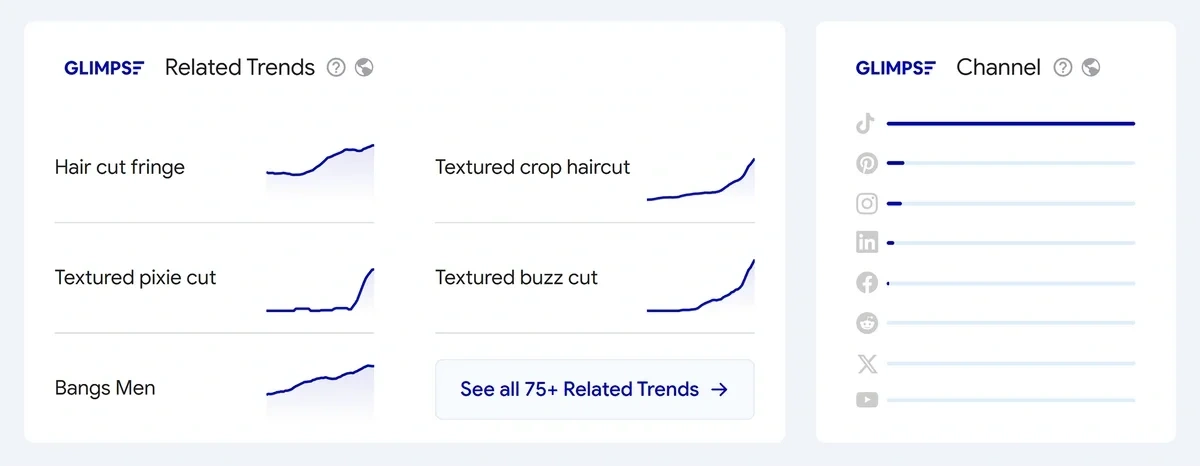
Similar to Exploding Topics, Glimpse tracks activity levels of topics on social media channels.
These are powerful features that enable trend analysis in a highly intuitive interface.
Glimpse has a few limitations of its own, however. You don’t get separate databases for products and startups like Treendly offers.
So if you’re only interested in exploring trending products, you’ll have to scan for them manually as you explore your category of interest.
Glimpse also has no meta trends or “collections” like Treendly offers to display a cluster of topics forming a single large trend.
Despite these shortcomings, Glimpse is a good tool for trend analysis with high-quality features for marketers and e-commerce stores.
How much does Glimpse cost?
Glimpse starts at $99/month.
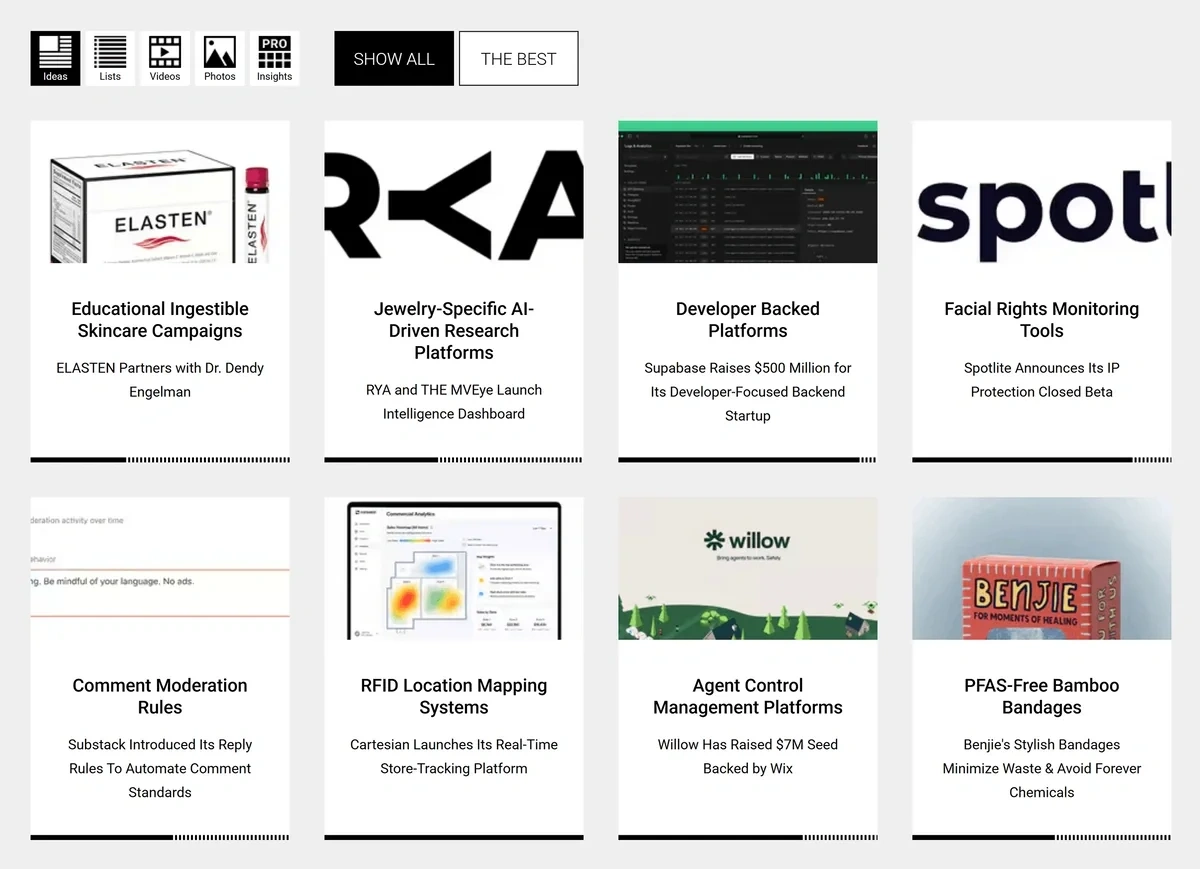
4. Trend Hunter
Trend Hunter specializes in tracking cultural trends powering the worlds of fashion, beauty, lifestyle, and tech.
The tool is geared toward creative strategists, marketers, and designers seeking inspiration from emerging trends and understanding the forces driving them.
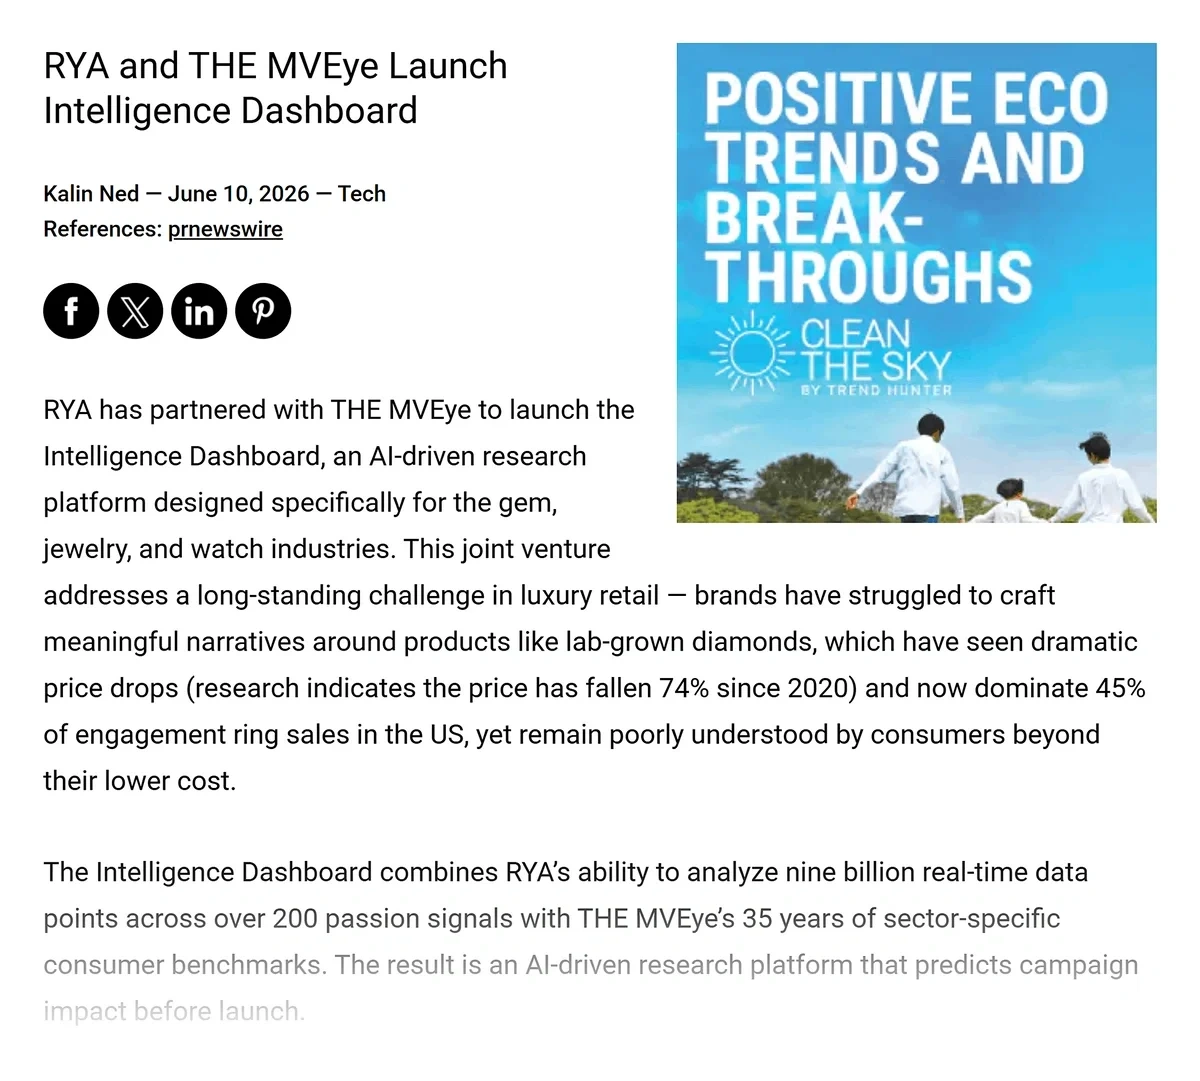
Trending topics and ideas appear in visual tiles, sorted by categories. Trend Hunter doesn’t show you any metrics for evaluating the popularity of a topic unless you click to open the full report page dedicated to it.
For every topic, Trendhunter has a mini report highlighting the background context in addition to themes and industry implications.
The analysis is highly qualitative, focusing on the why rather than hard metrics for estimating how strong a trend really is.
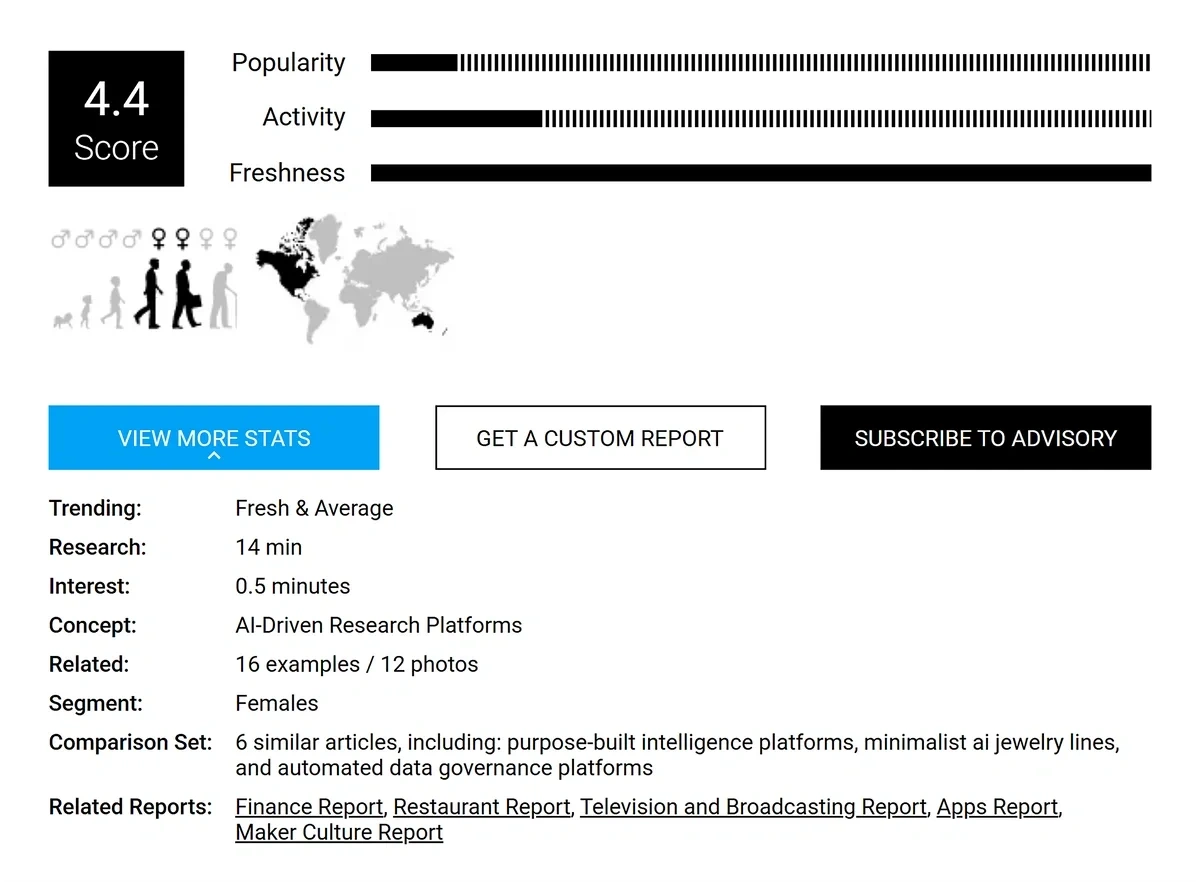
That said, the tool also includes some index-based numbers highlighting popularity, activity, and freshness. These are used to generate a score.
While these numbers help you evaluate topics on a relative scale, the lack of absolute numbers like search volume or growth percentage makes it hard to interpret these scores generally.
I like the annual reports Trend Hunter publishes that dive deep into emerging trends relevant for the year ahead.
The Consumer Insights report is one of the highlight features of the tool.
It’s similar in philosophy to Treendly’s “Collections” in that they both reveal high-level topics composed of several niche trends.
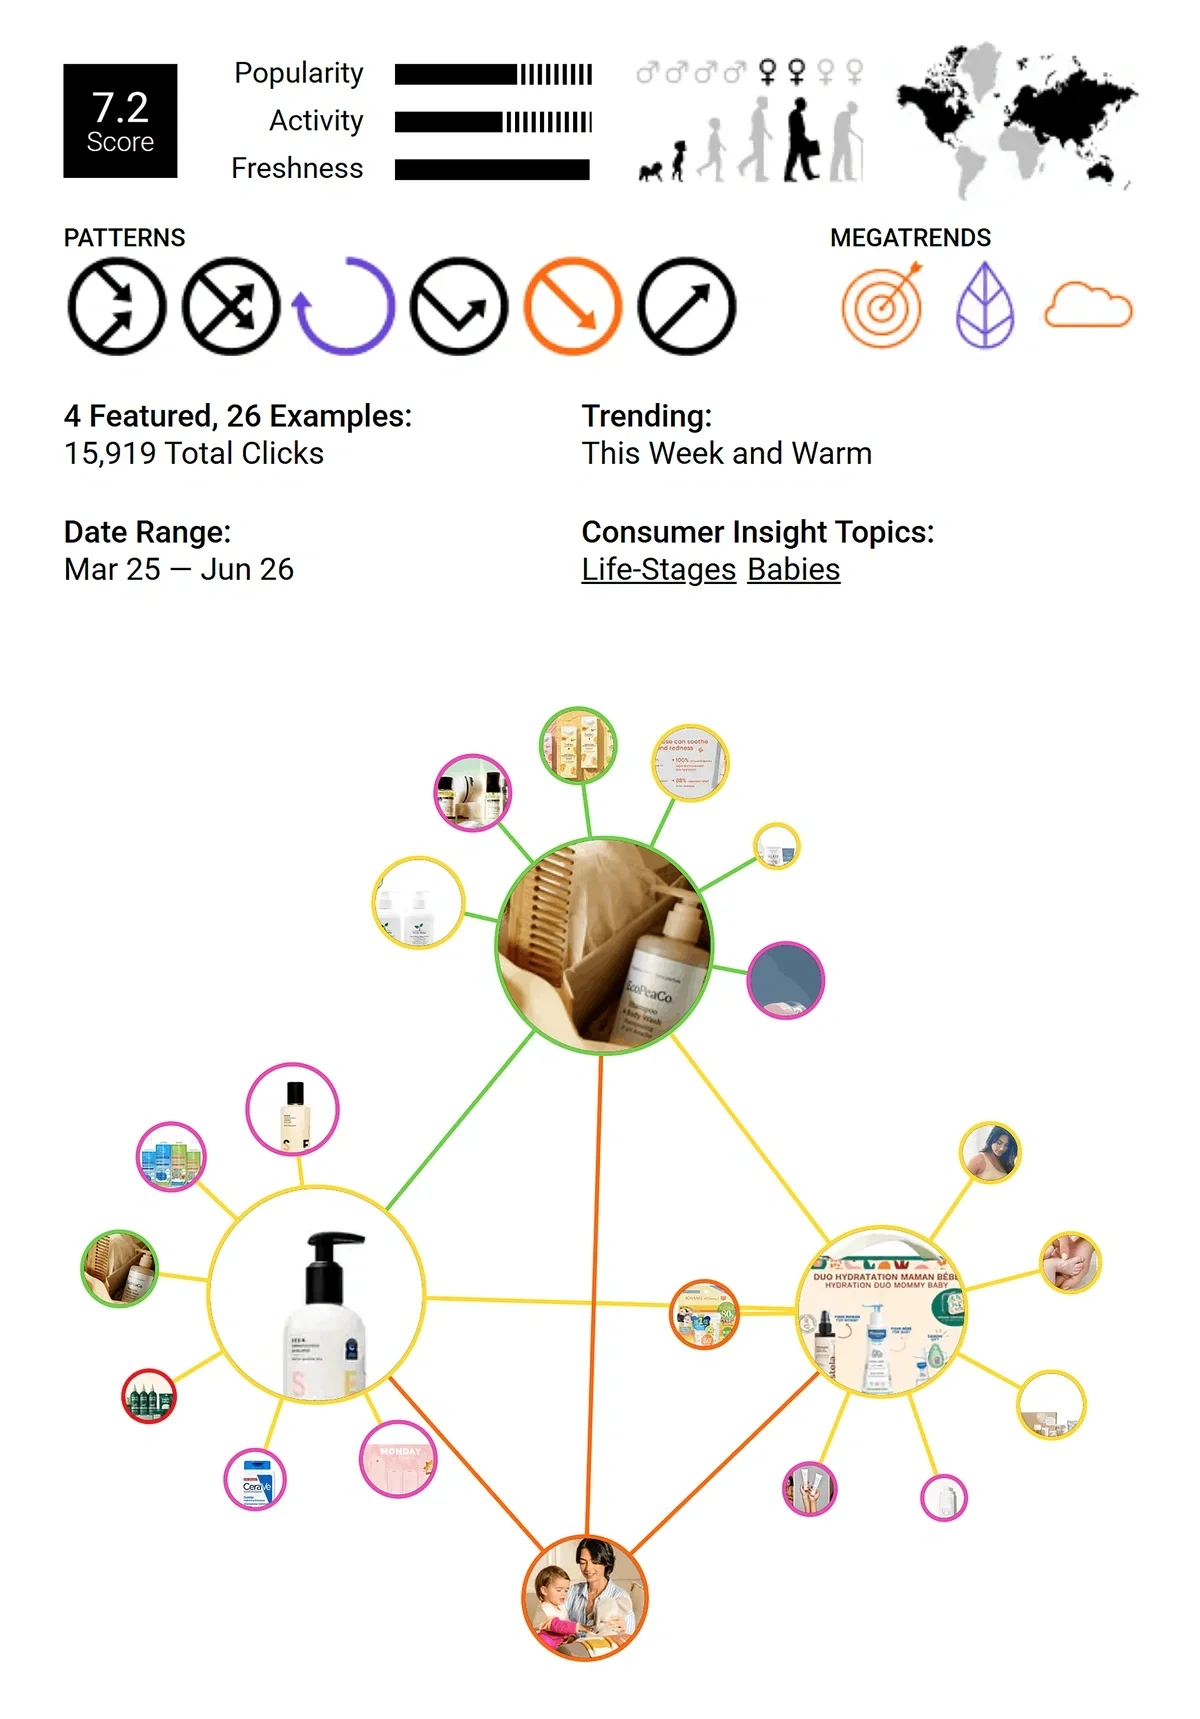
For every major consumer insight, the report also shows examples of ideas and concepts associated with a broad topic.
So if you’re wondering how a major cultural pattern is translating into real-life concepts, strategies, and products, these examples give you tangible ideas for a clear understanding.
For more details, check out our 2026 Exploding Topics vs Trendhunter comparison.
How Much Does Trend Hunter cost?
Trend Hunter offers a small selection of trends to explore for free. Paid plans start at $199/month (billed annually) for single-user access.
5. Pinterest Trends
Pinterest Trends is an underappreciated tool in the trend analysis software space.
As a platform, Pinterest is frequented by tons of people for discovering ideas, solutions, tips, and products.
Pinterest Trends uses that data to highlight what’s trending with a good deal of useful information for marketers and designers.
There are two types of trends you can track with Pinterest Trends: shopping trends and general search trends.
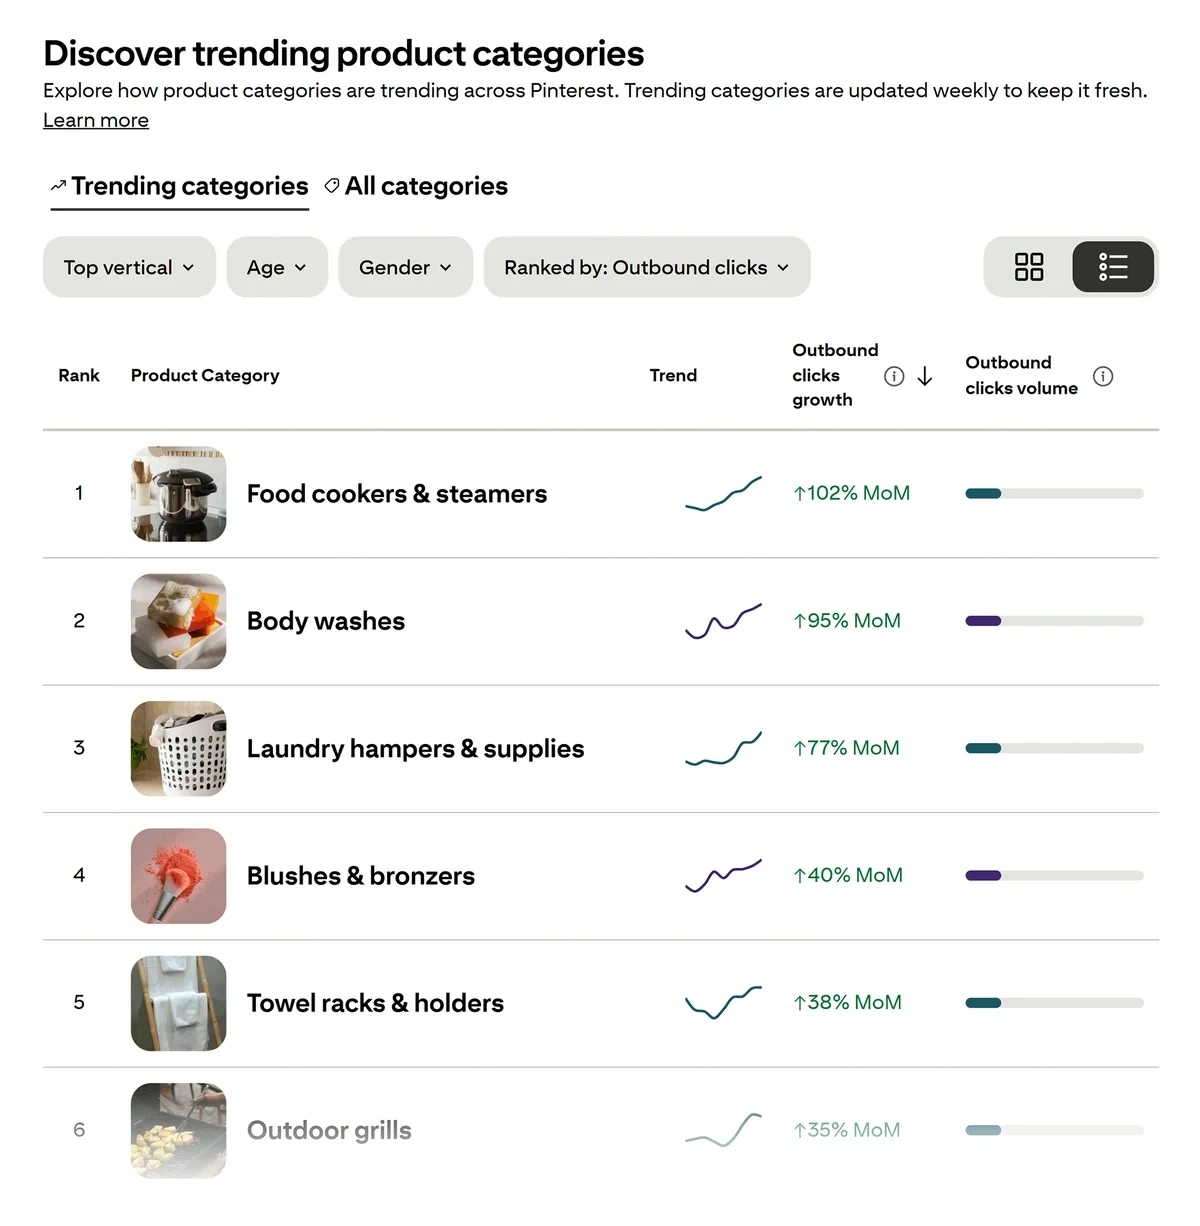
Shopping trends are listed in order of outbound clicks.
This is a useful metric that shows real purchase intent since people are clicking pins related to a product to visit the source website.
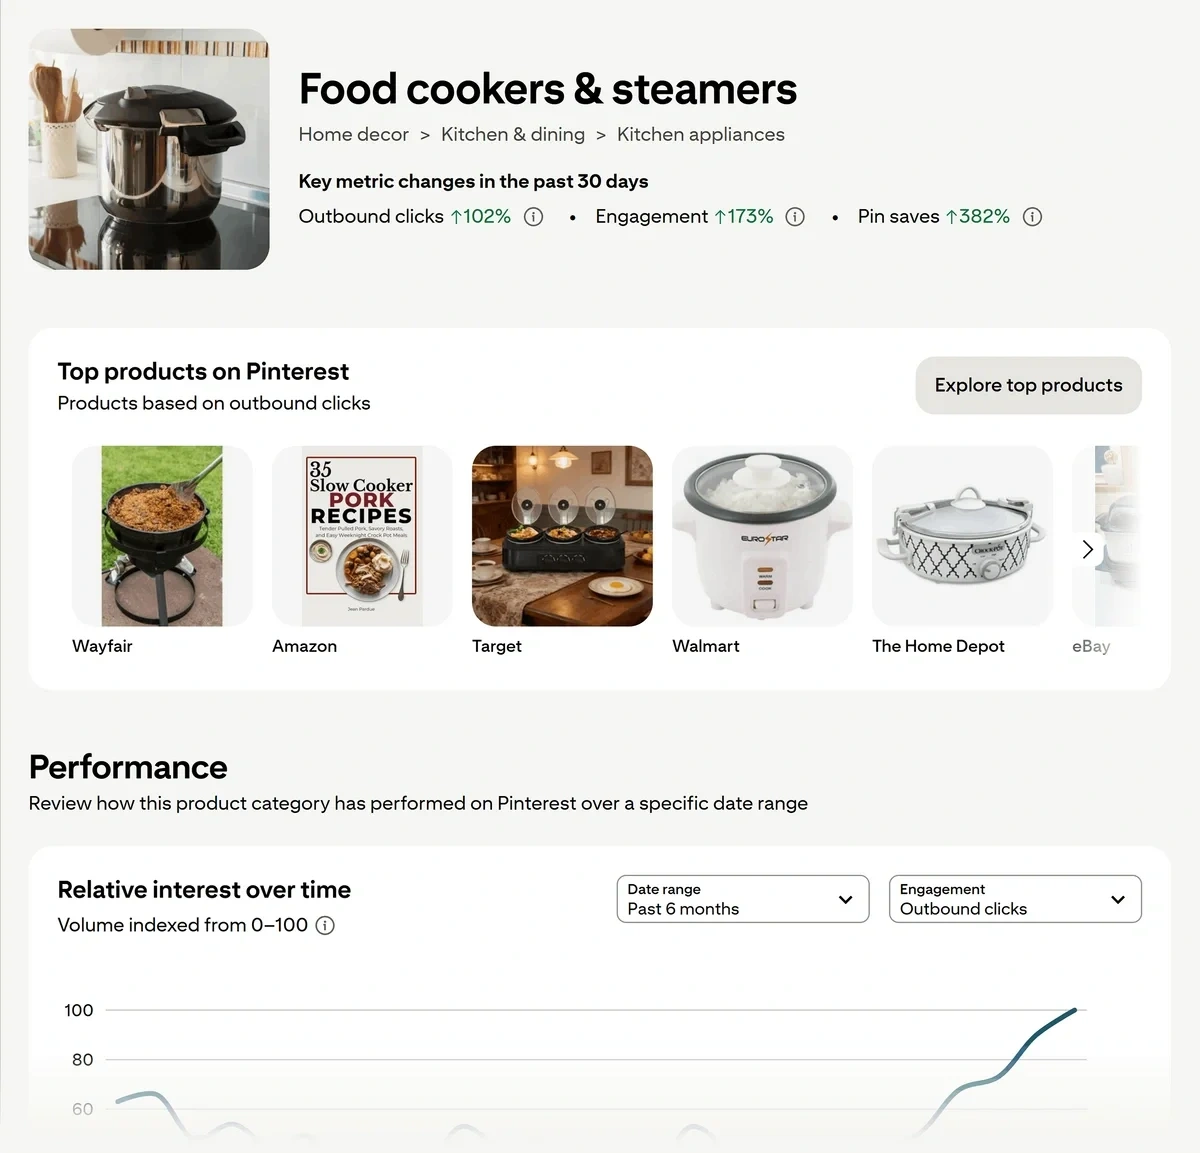
Inside each product category page, you’ll find a performance chart illustrating interest over time.
You also get summarized metrics for changes in outbound clicks, engagement, and pin saves in the past 30 days.
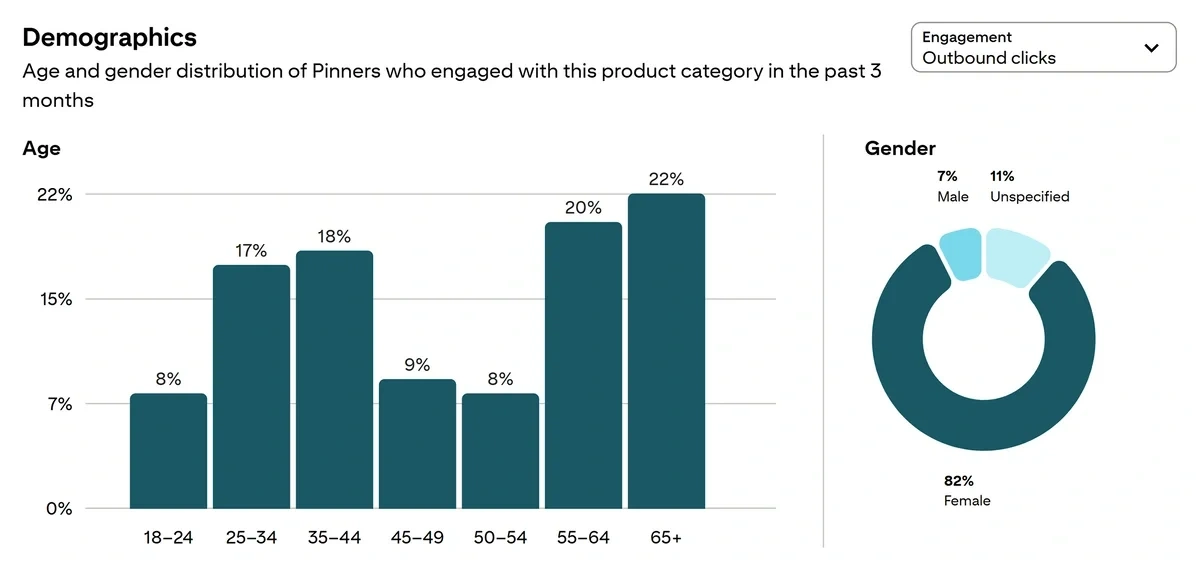
Additionally, Pinterest gives you demographic data with age and gender distribution charts showing how engagement with the pin has changed over time.
The other report focused on general search terms is similar to the one we get for shopping trends, but there are some differences.
Shopping trend data is more focused on clicks and engagement. But for trending search terms, you get the relative search volume as the primary metric.
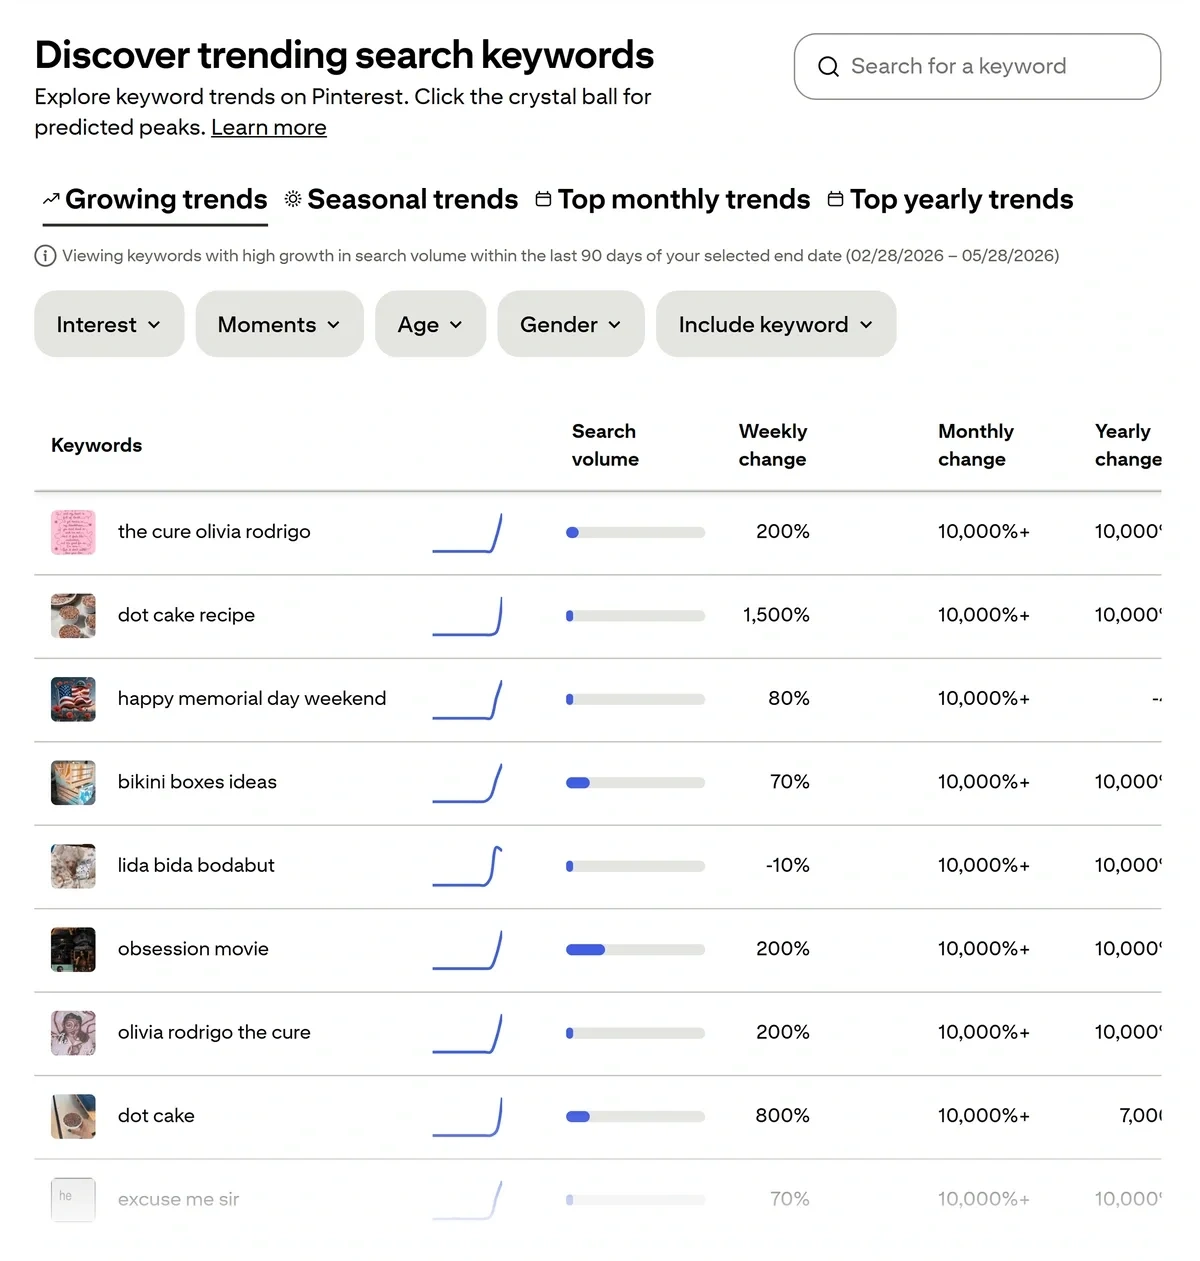
Pinterest shows you relative interest over time for the specific trend you’re exploring, measured over a period of up to 2 years.
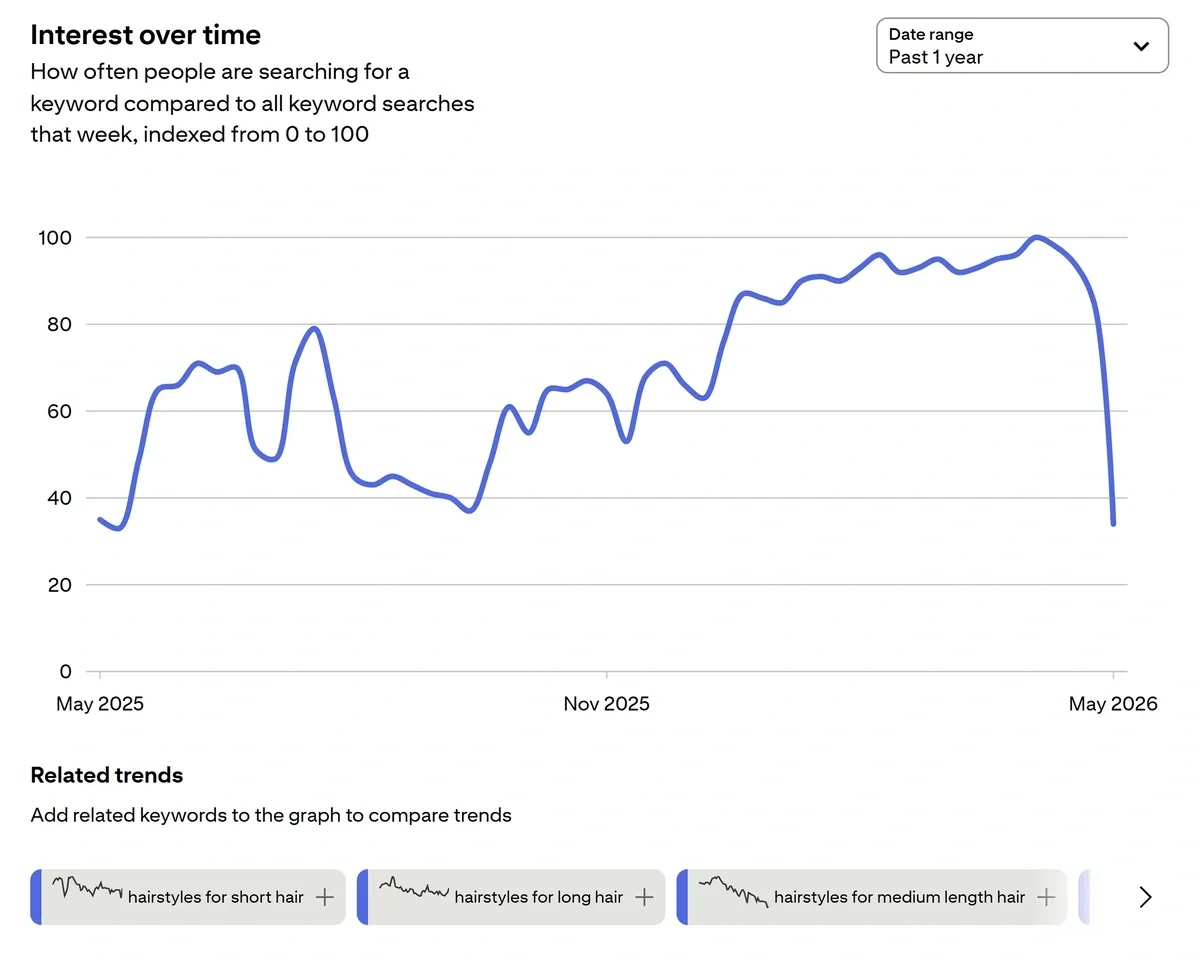
Demographic data also features prominently here, in addition to related trends that you can analyze and compare on the same graph.
This is a great feature to have that makes analysis of similar topic trends easier.
And I also like having a curated list of popular pins associated with the topic, so you have the exact visual evidence for the kinds of pins that are trending right now.
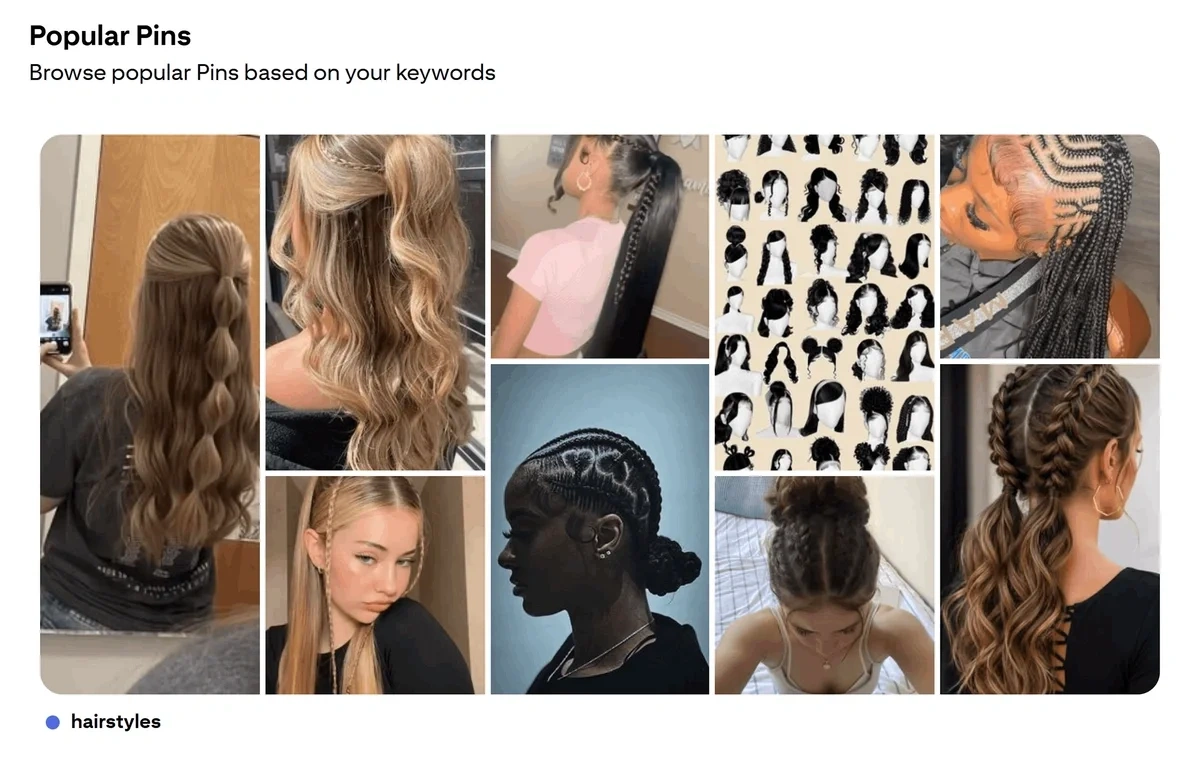
I think Pinterest Trends is a tool that should absolutely be in your stack, especially if you’re a business operating in lifestyle, beauty, and fashion niches.
How much does Pinterest Trends cost?
Pinterest Trends is a free tool.
Which Treendly alternative is the best?
Treendly exists in a competitive space that has several strong alternatives. The right choice depends on your use case and the features you need.
If you want to gauge the popularity of a keyword you already know, Google Trends is a great tool in itself.
E-commerce stores, marketers, and investors who need more contextual data and real search volume for trending products, topics, and companies are much better served by Exploding Topics.
Glimpse is a good choice for expanding Google Trends data with additional insights and researching People Also Search data in a structured way.
Trend Hunter and Pinterest Trends are useful tools for certain niches like beauty, fashion, and lifestyle for businesses seeking creative inspiration.
Once you’ve picked your tool for trend analysis, see our guide on finding new trends and deriving value from them.
Stop Guessing, Start Growing 🚀
Use real-time topic data to create content that resonates and brings results.

Exploding Topics is owned by Semrush. Our mission is to provide accurate data and expert insights on emerging trends. Unless otherwise noted, this page’s content was written by either an employee or a paid contractor of Semrush Inc.
Share
Newsletter Signup
By clicking “Subscribe” you agree to Semrush Privacy Policy and consent to Semrush using your contact data for newsletter purposes
Written By


Osama is an experienced writer and SEO strategist at Exploding Topics. He brings over 8 years of digital marketing experience, spe... Read more