


Get Advanced Insights on Any Topic
Discover Trends 12+ Months Before Everyone Else
How We Find Trends Before They Take Off
Exploding Topics’ advanced algorithm monitors millions of unstructured data points to spot trends early on.
Keyword Research
Performance Tracking
Competitor Intelligence
Fix Your Site’s SEO Issues in 30 Seconds
Find technical issues blocking search visibility. Get prioritized, actionable fixes in seconds.
Powered by data from
Latest Blog Posts
Featured Case Studies
See what's trending before everyone else
Each week, we'll send you our best Exploding Topics. Plus, expert insight and analysis.
Treendly Review: Can You Rely On It for Trend-Spotting?

 Add Exploding Topics on GoogleAdd Exploding Topics as your preferred source to see more of our stories on Google.
Treendly is a very impressive trend detection platform that businesses can use to spot emerging topics and concepts.
I tested every major feature of the tool.
There’s a lot that I like about Treendly, from its neat user interface and well-designed main dashboard to the quality of topic data.
Naturally, it has several weaknesses, such as limited product data.
Here’s what I think about the quality and usefulness of the core Treendly features:
The Treendly Dashboard
The first screen you’ll get when logging into your Treendly account is the dashboard.
I’m quite fond of Treendly’s updated dashboard.
It’s structured into three sections:
- Trends you’re tracking
- Latest topics added to the Treendly database
- Trends recommended for you
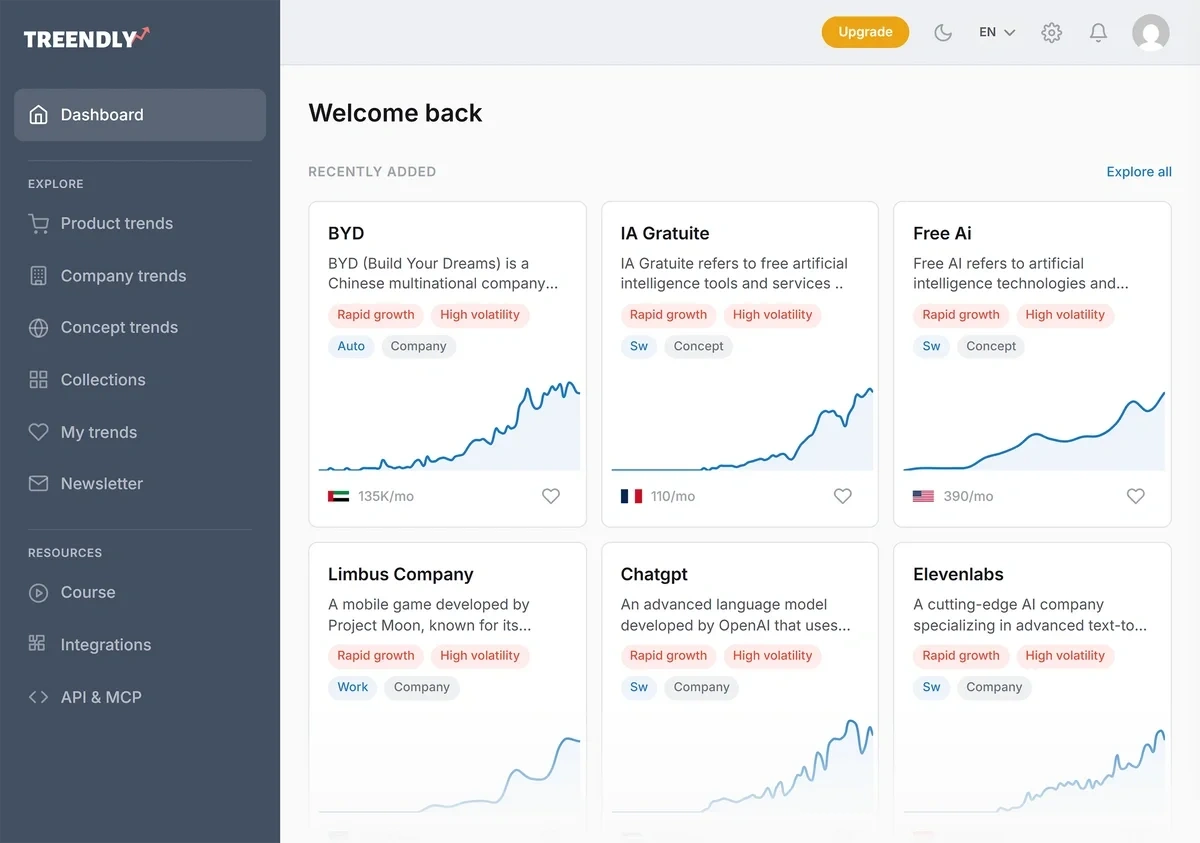
That’s it. I prefer simple dashboards free from distractions. And Treendly does a great job with that.
I’m not too sure about the “Recommended for you” section.
I found these topics to be outside the orbit of my interest, so it’s not necessarily all that useful.
Regardless, my dashboard experience left me feeling good about the tool overall.
Strong Concept Trend Library
Treendly’s concept trend library tracks topics across a wide range of categories.
There are 16+ categories, so you can easily find something that’s close to your niche.
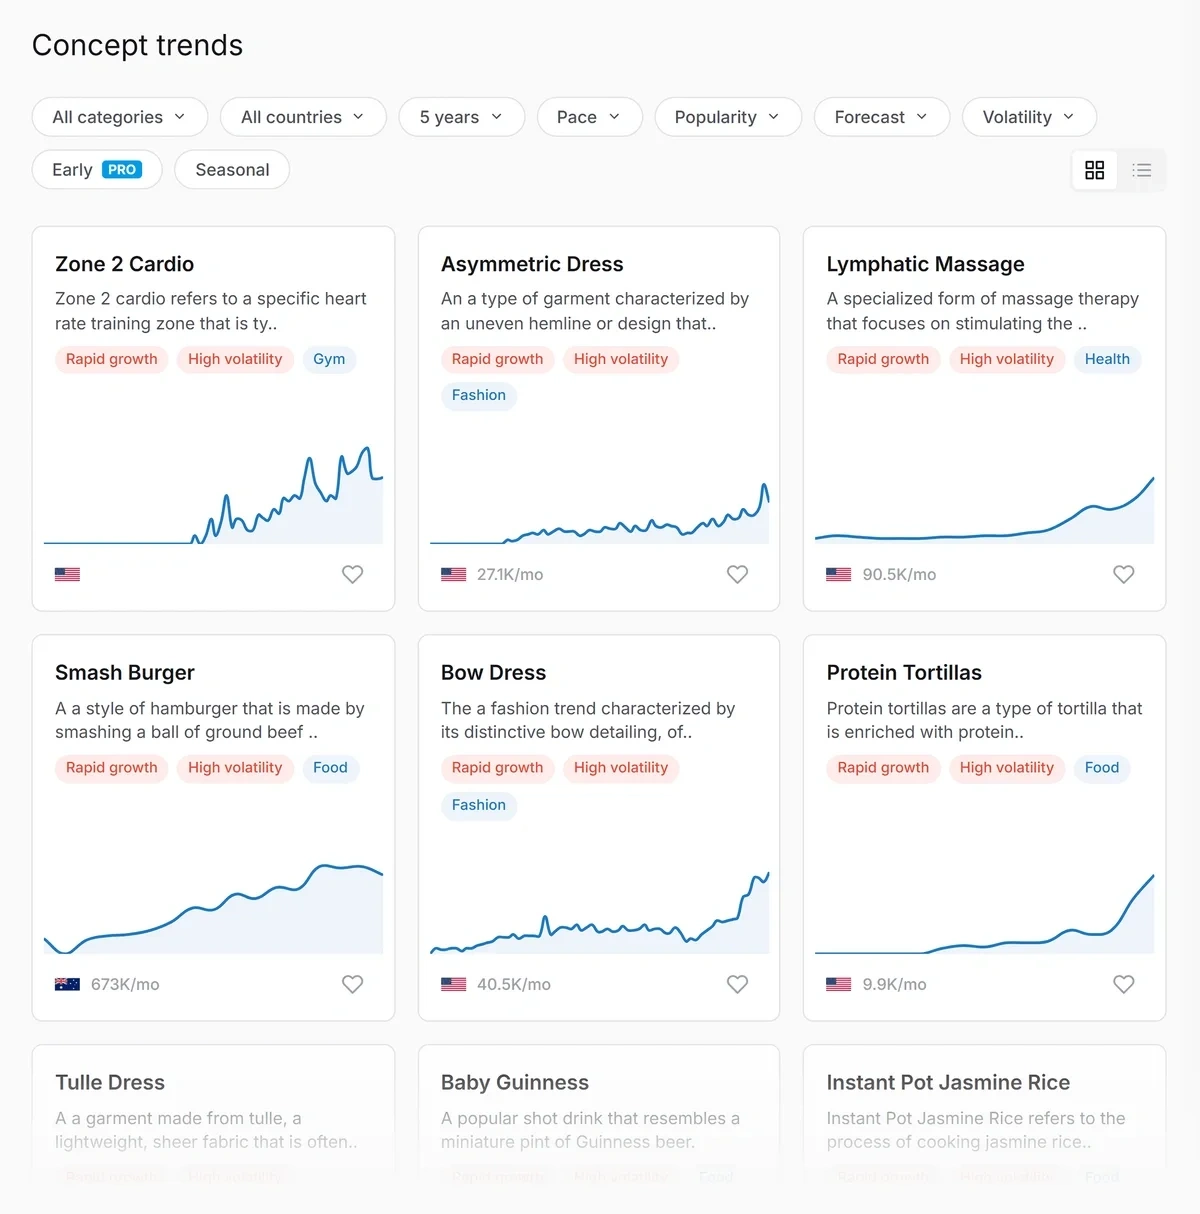
The presentation of trend data is simple and intuitive.
It’s reminiscent of Exploding Topics, which also displays trend cards with a mini-chart highlighting trend growth, along with search volume data.
The filtering options are excellent. Treendly lets you sort available trending topics and concepts by:
- Category
- Country
- Timeframe
- Pace (rate of growth)
- Popularity
- Forecast
- Volatility
- Seasonality
- Freshness
So you have tons of options for dialing in the filters when you need to find topics meeting precise characteristics.
When you click on any trend, you can zoom in on the details and uncover a bunch of additional data.
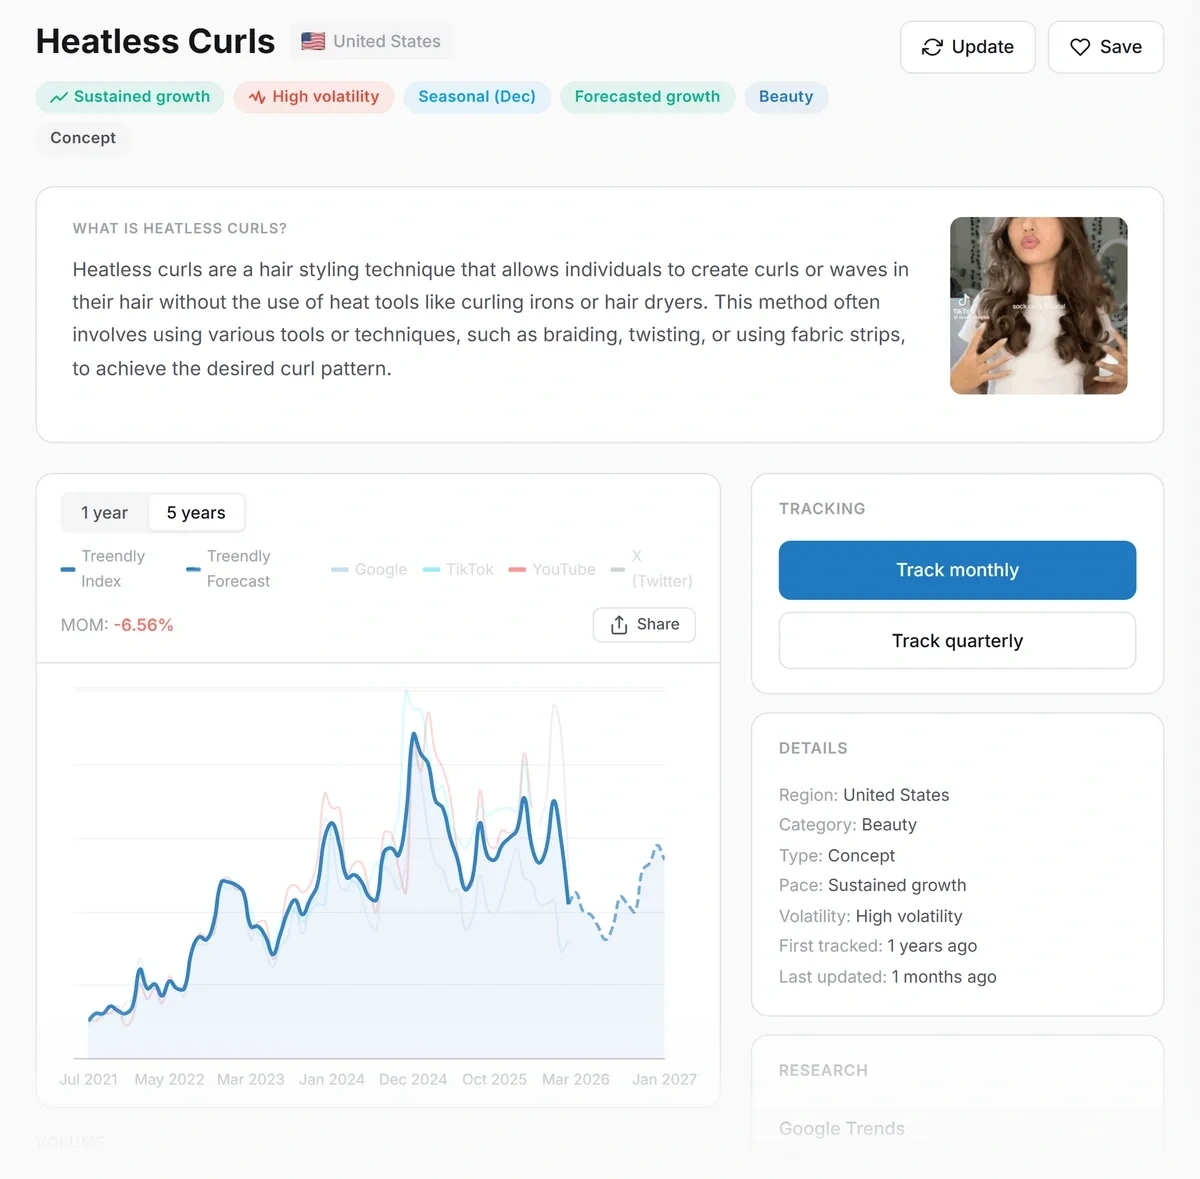
The dedicated trend pages start with a brief summary of the concept, followed by a trend chart.
The chart uses the Treendly index to measure the popularity and search interest of the topic. You can also see forecasted growth on the same chart.
So if you want to perform trend-based keyword research, this is one way to go about it.
Next, the tool shows you the search volume for the trend and also gives a nice demographic breakdown of the interested audience.
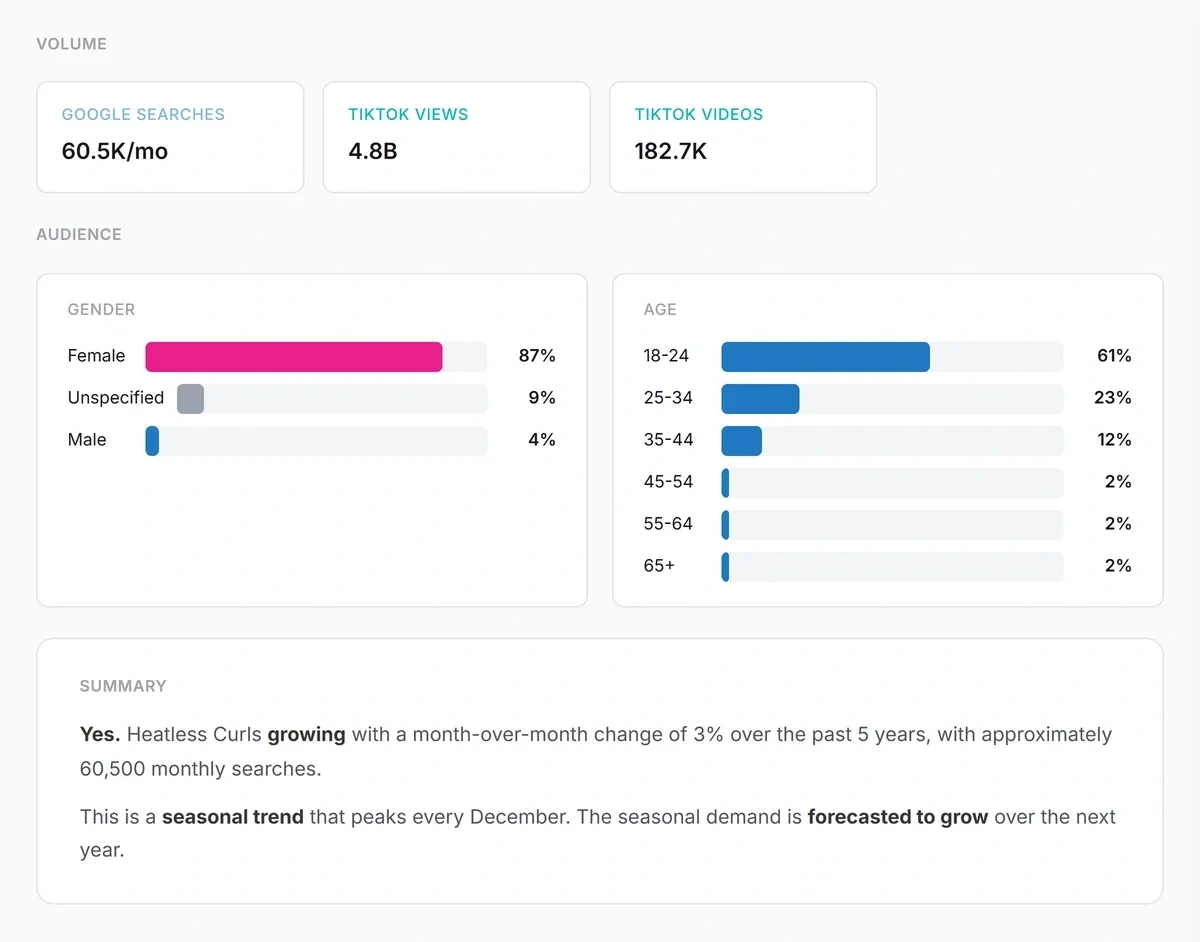
Knowing the gender and age distribution of the audience interested in a trend is important for your marketing and product strategies.
So it’s a valuable addition that Treendly has made to its trend analysis data.
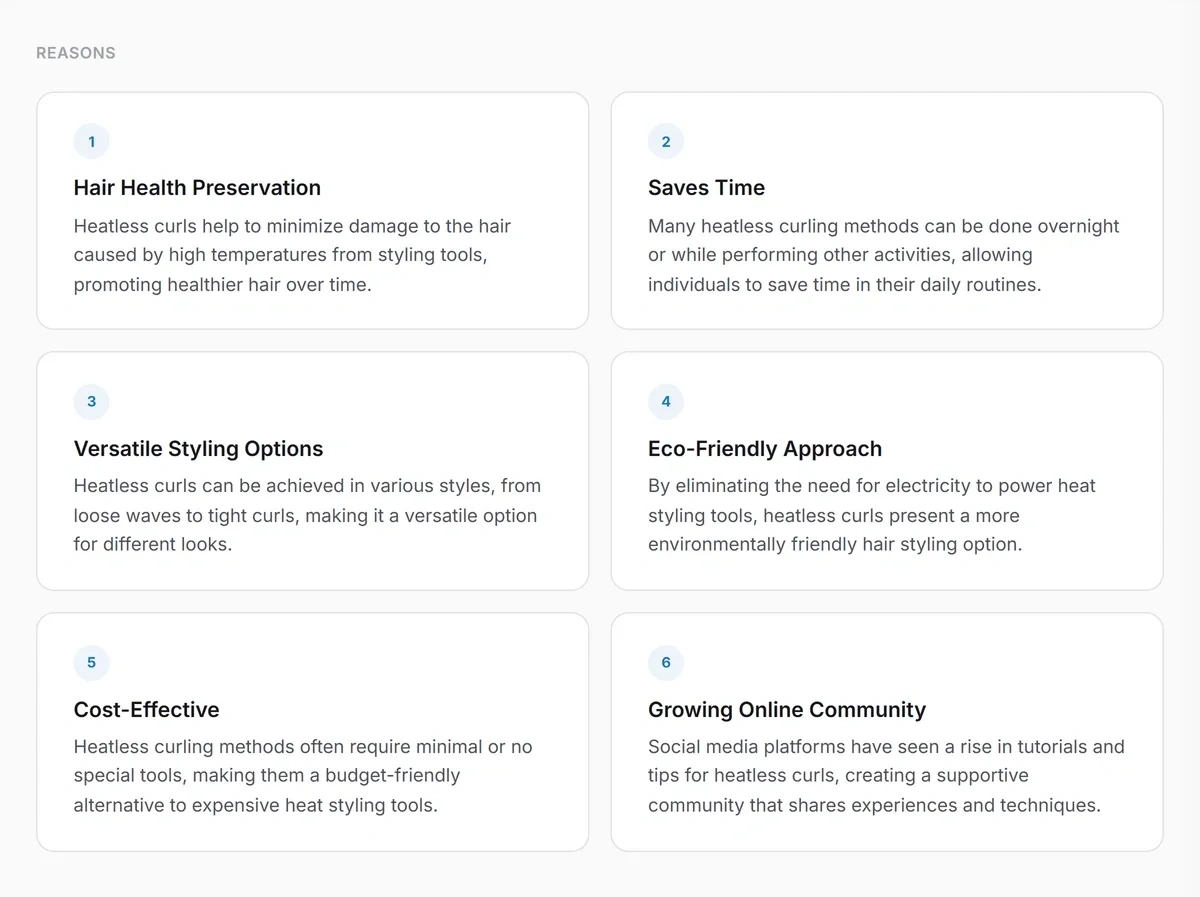
Another feature I like is the analysis of reasons why a trend is getting popular.
While the reasons it suggests are usually fairly standard and easy to guess, it’s still nice to get some idea of the WHY behind a trending idea.
The related queries feature is my favorite.
A quick look at this table can inspire a bunch of great ideas for your content and product because these searches reveal people’s specific questions and problems related to the core topic.
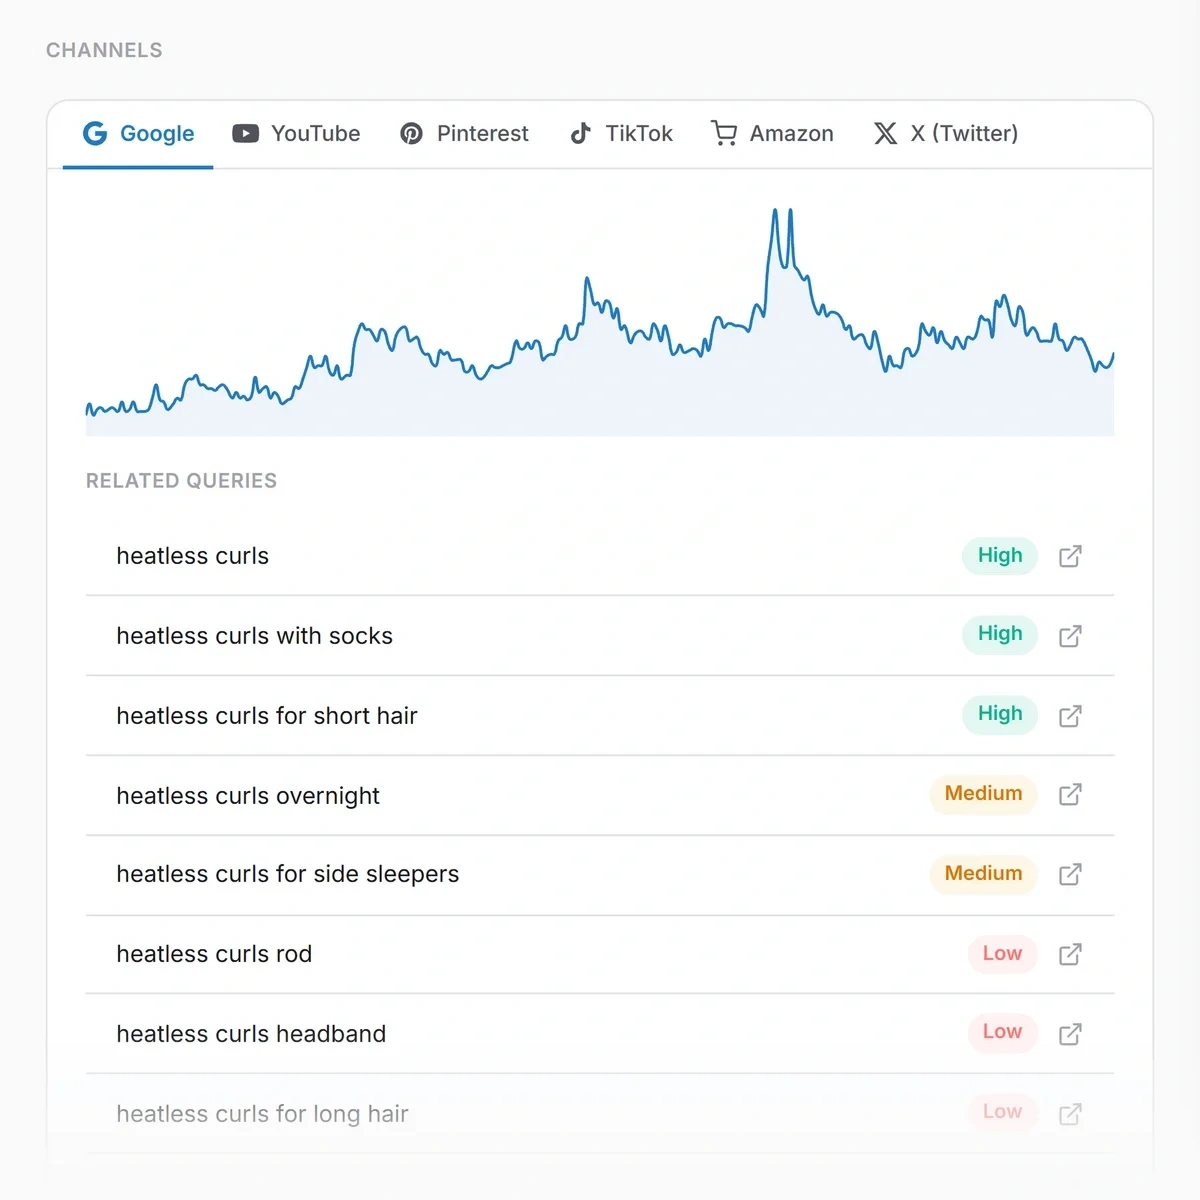
And Treendly shows you these related searches across Google, YouTube, Pinterest, and Amazon.
That’s fantastic data to have if you really want to understand how a trend is translating into real searches on top platforms.
There is one drawback here if I compare this feature to a similar aspect of Exploding Topics.
With Treendly, you don’t get the exact volume of the related searches or a trend chart. You only get a vague label indicating if it’s a “high” or “low” trend in terms of search interest.
Exploding Topics shows you the actual growth numbers for each related trend as well, so you can compare topics based on absolute metrics.
Finally, Treendly also shows AI insights based on forums and Reddit discussions.
It summarizes the sentiment around the topic and lists common questions and pain points.
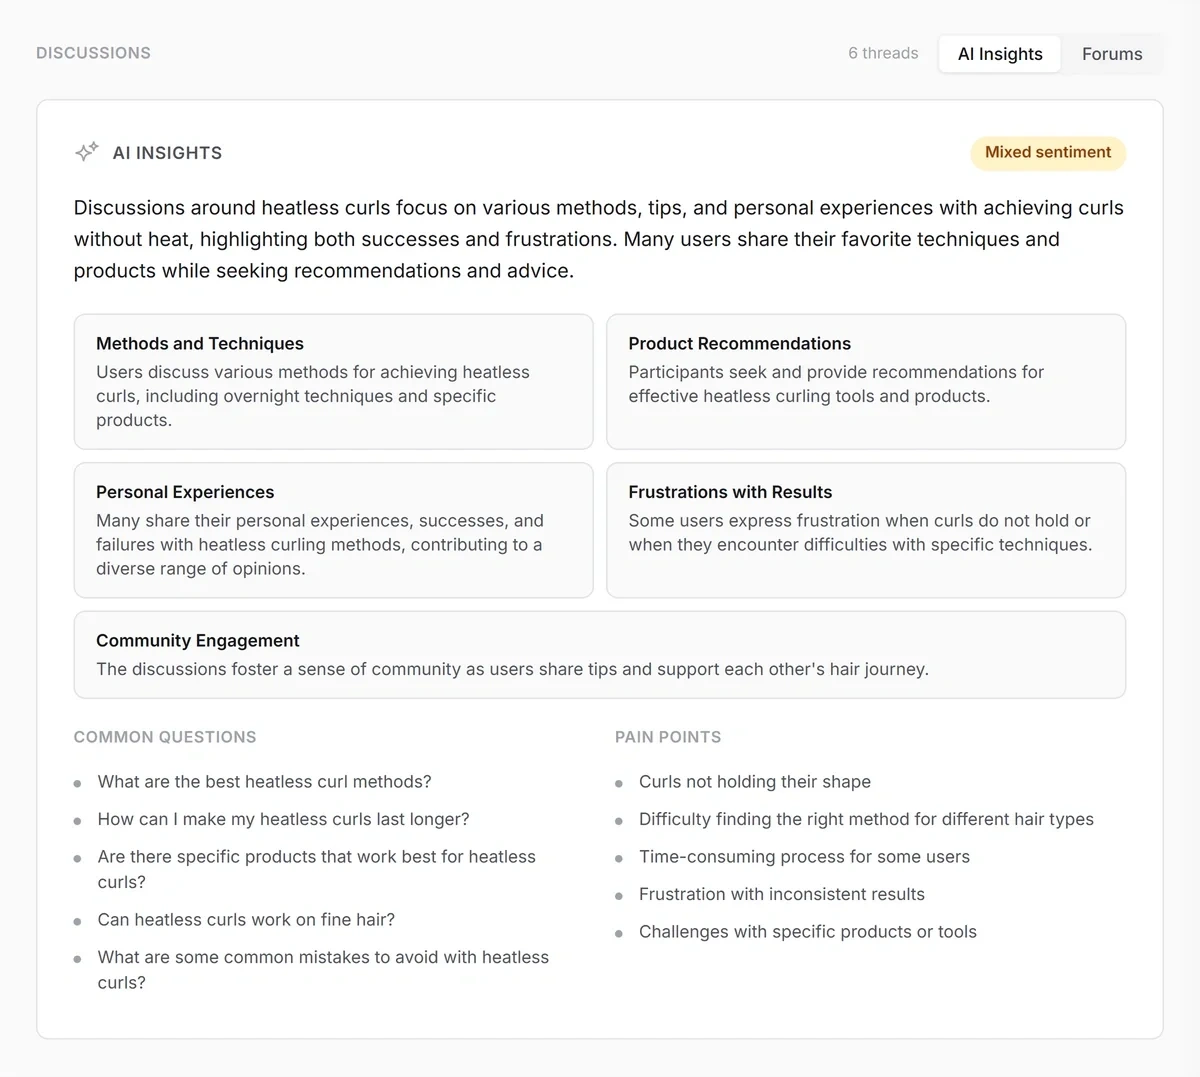
You can also see a list of forums and Reddit threads gathered by the tool for the topic.
In my experience, this is generally pretty good, even though there are always a few spam threads listed.
But if you want to see what people are saying about a topic, it’s a pretty solid feature.
Product Trends Database Provides Good Insights
The front page of the product trends screen is identical to the concept trends page.
You get a list of trend cards displaying a chart and volume along with labels indicating trend characteristics.
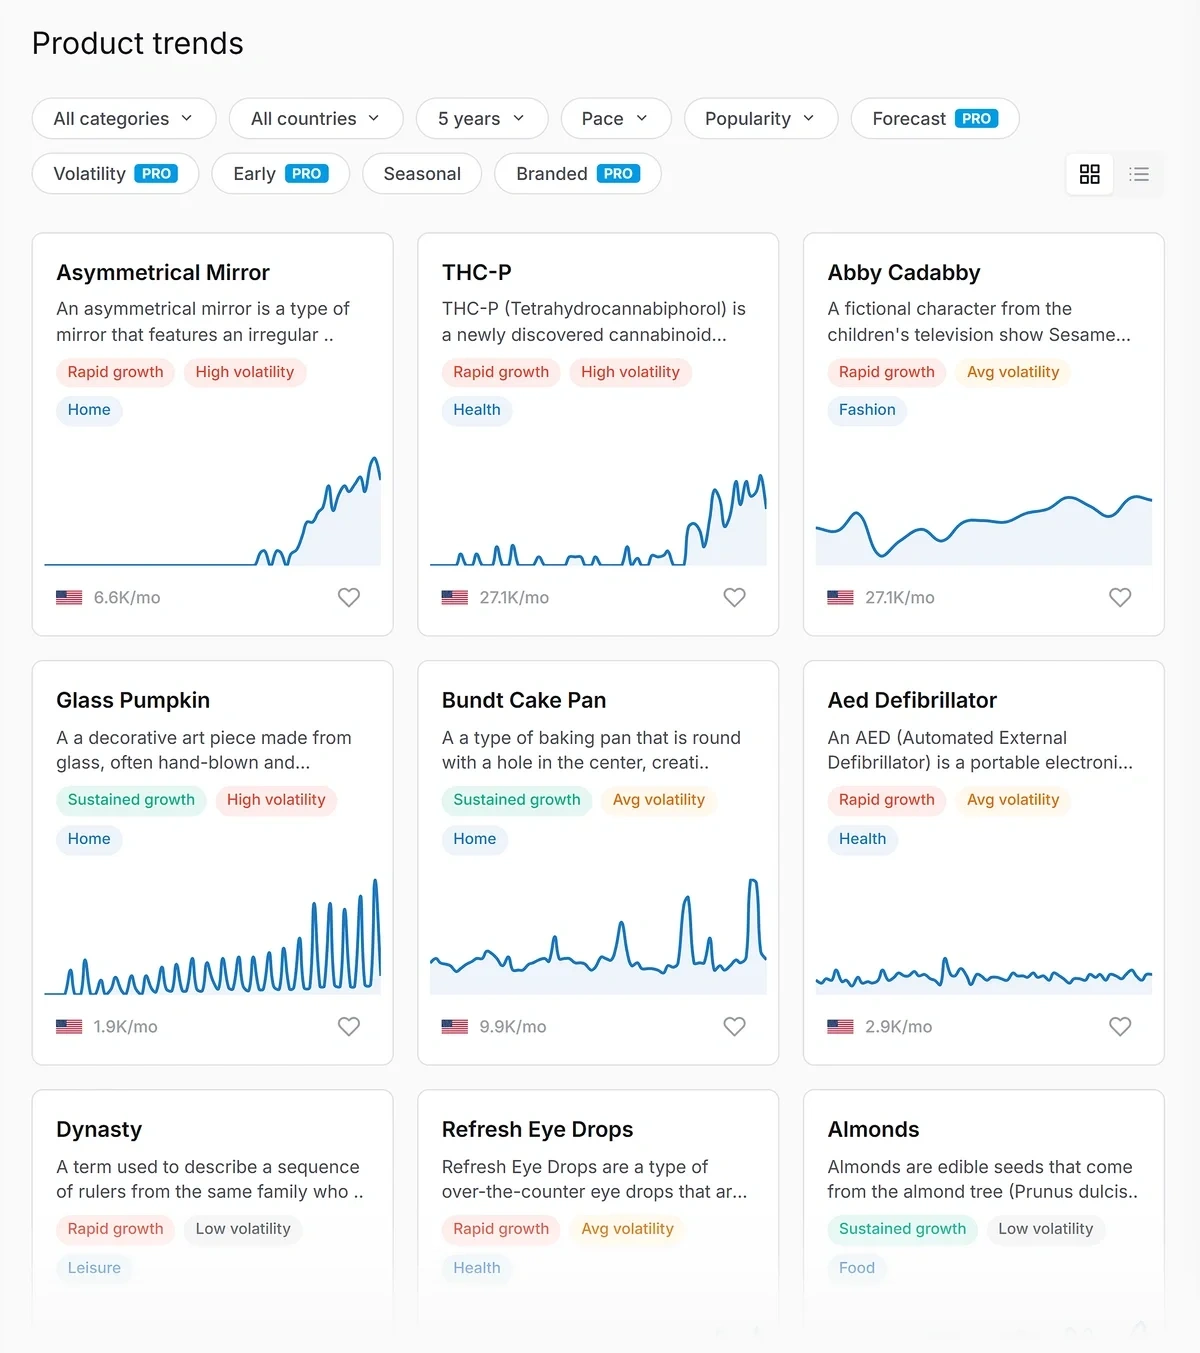
While this is pretty good for finding products with strong trends, you’ll typically need more than just search growth metrics to make strategic decisions for your online store.
For instance, Exploding Topics couples the trend data with product and sales performance to paint a much more comprehensive picture that you need for product research.
But beyond that, Treendly offers some additional useful metrics of its own when you click through to a specific product trend page.
In addition to the Google and Treendly index, the tool also shows the indexes for Pinterest, YouTube, and Amazon.
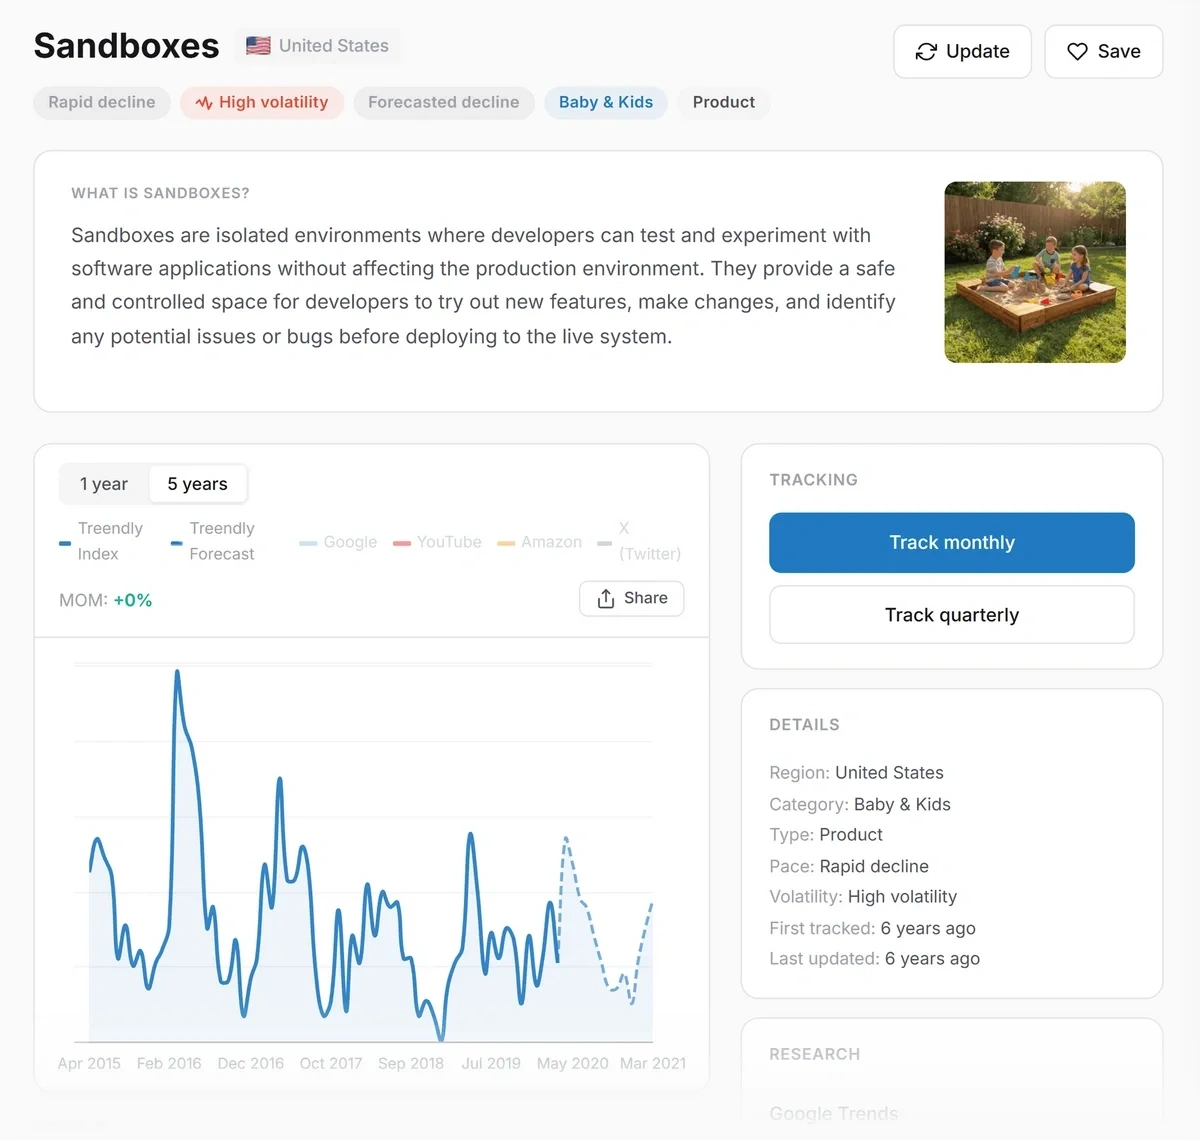
That way, you can determine how popular a product is on high commercial intent platforms like Amazon.
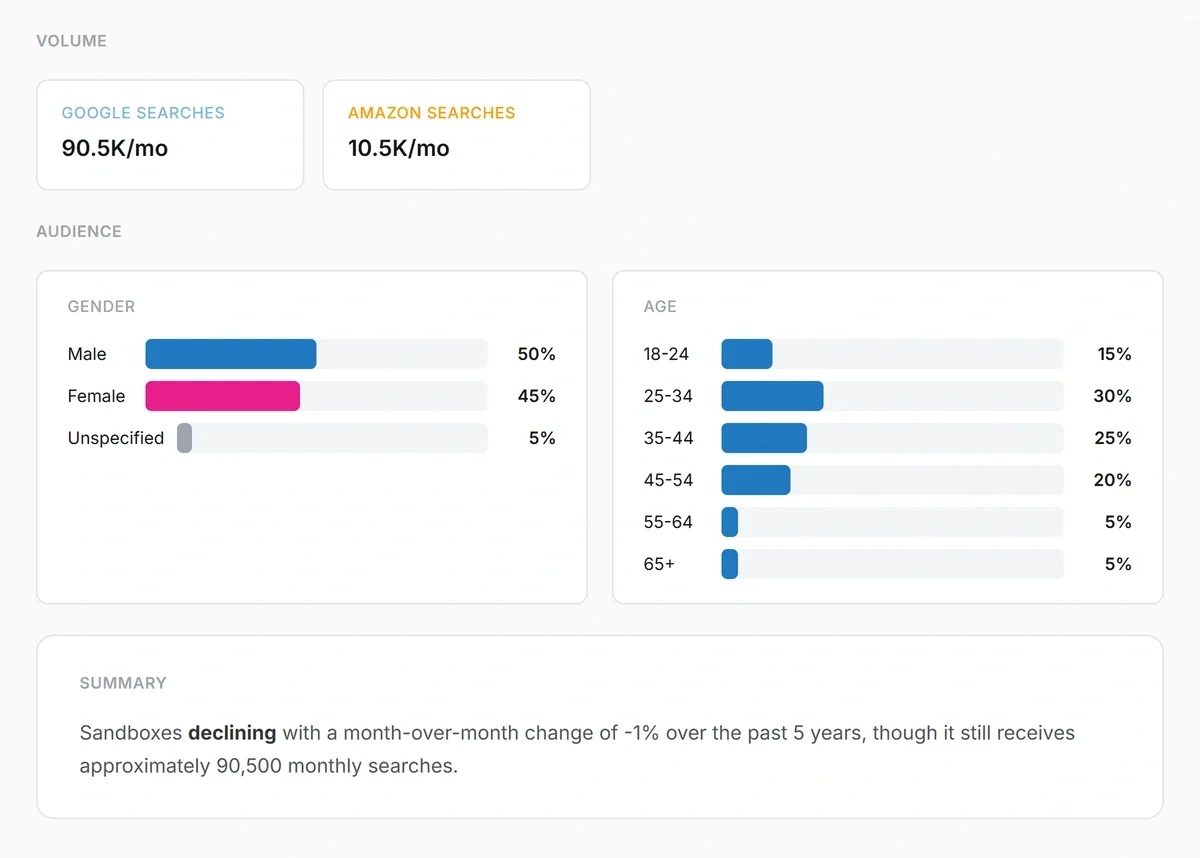
In addition, the tool gives you the search volume for Amazon as well. This is quite helpful for e-commerce stores researching products and pricing.
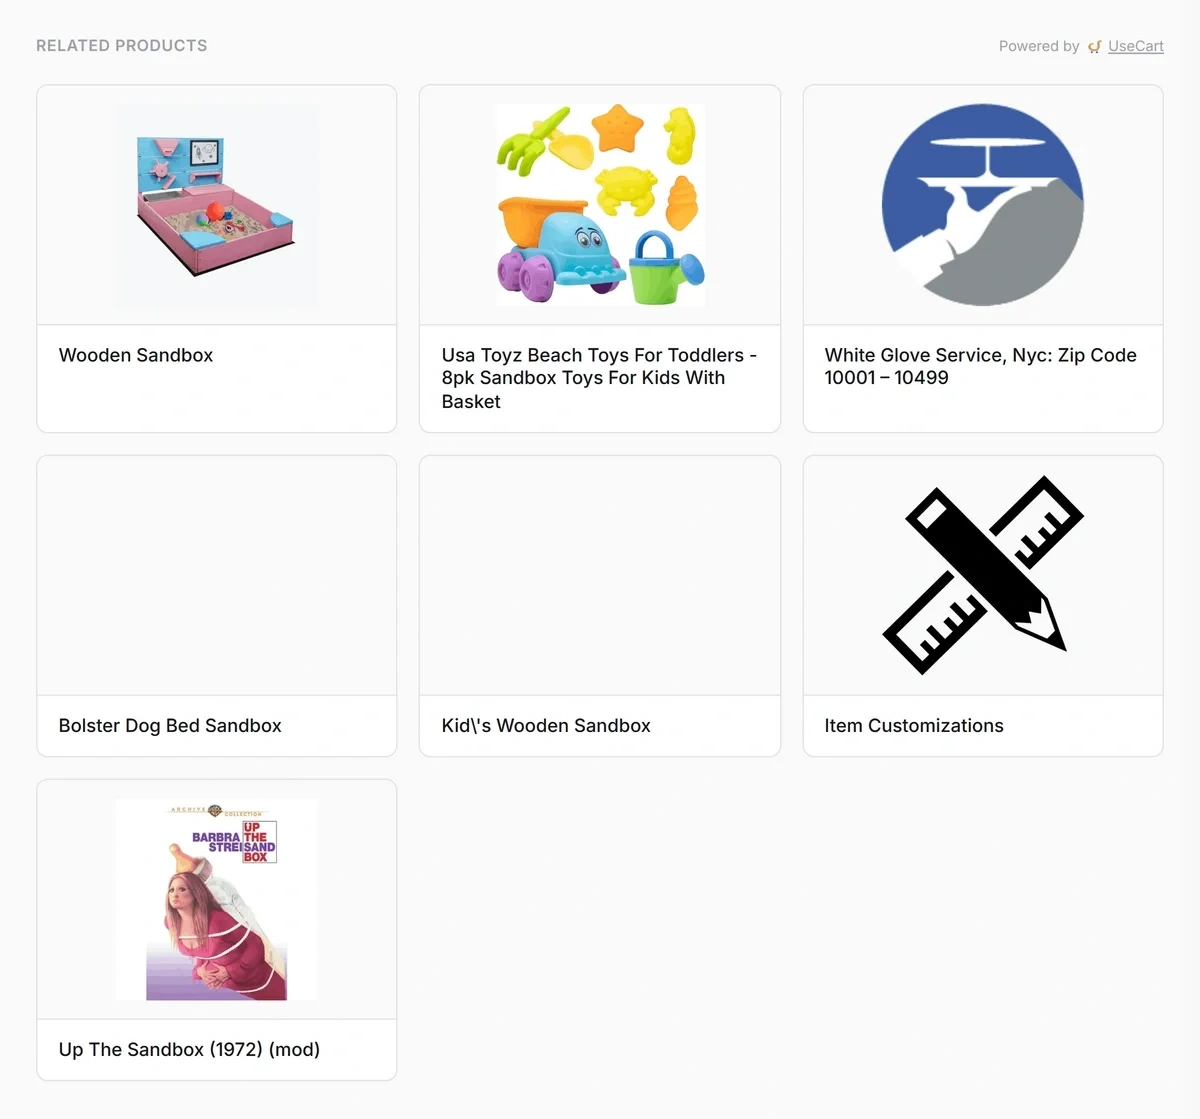
The tool also pulls similar products in the Related Products panel. This works great if you need examples of actual products associated with the trend.
Treendly even finds influencers in the same product space, so you can explore their content for inspiration and promotion opportunities as well.
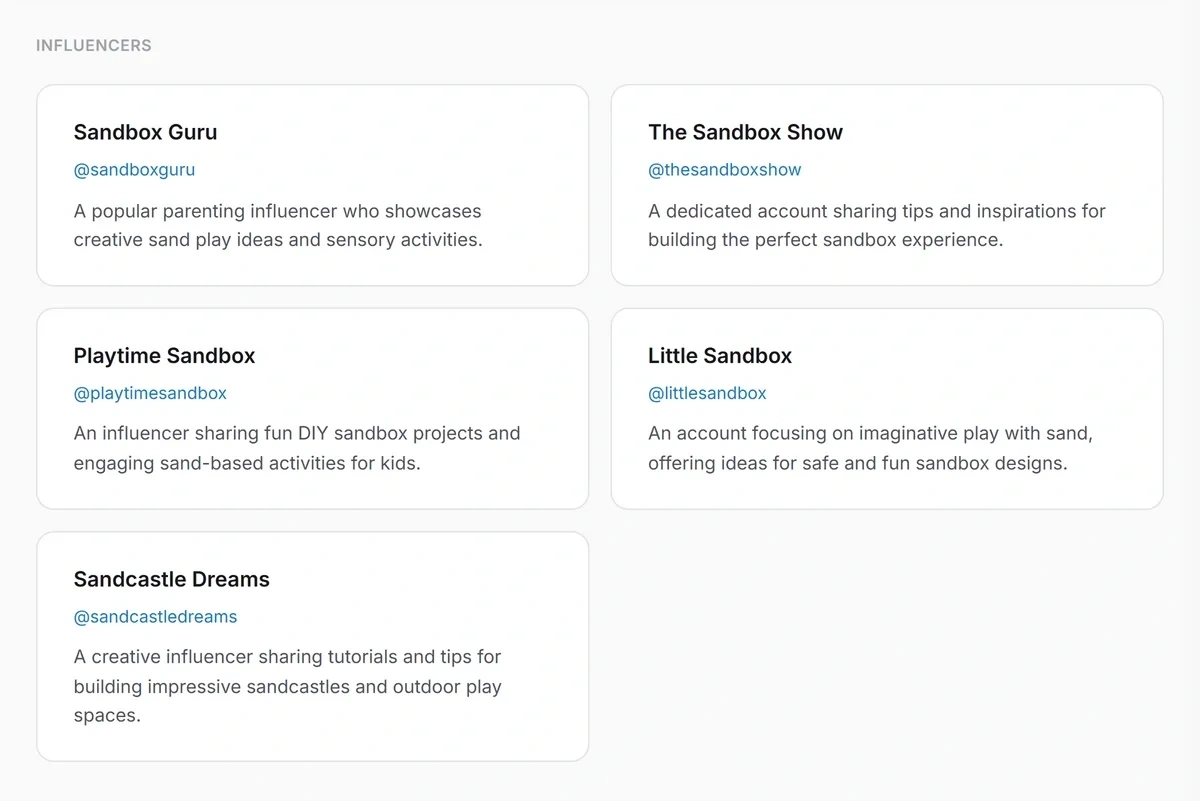
I think e-commerce stores will find a lot of value in these features, whether you’re looking for inspiration for product design or making better stocking decisions to optimize your sales and inventory.
Decent But Limited Company Trends Database
The third main Treendly feature is the Company Trends database.
This is where you’ll find emerging startups and companies that are trending in search.
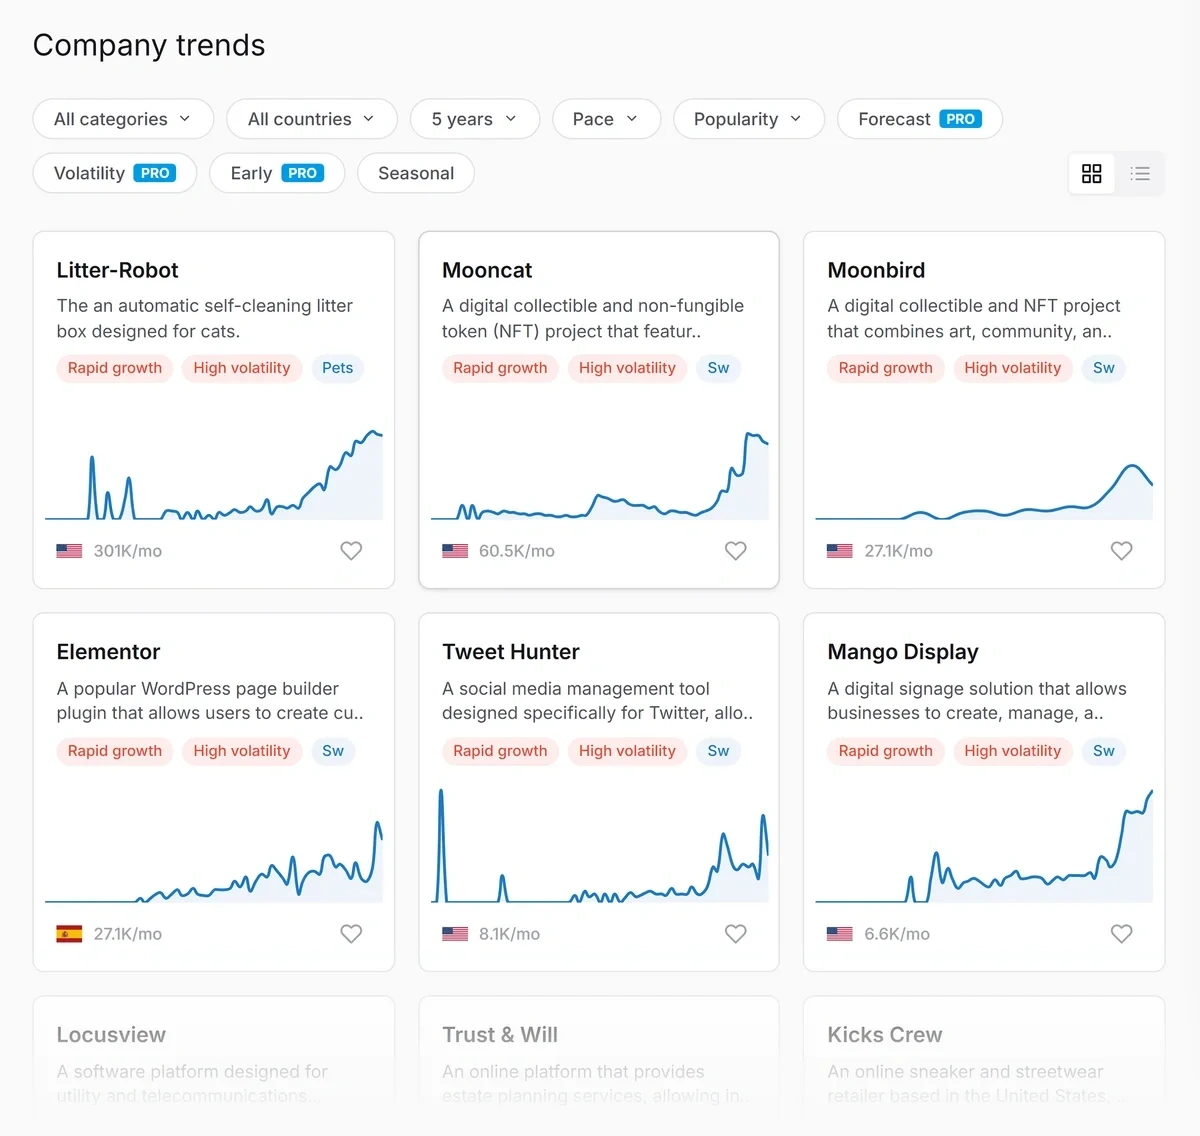
While this is pretty good if you just need to find startups rising rapidly in search popularity, the data lacks context that you’ll usually need to assess a company’s overall standing and valuation.
As you click open a company trend, Treendly simply gives you the same details that you get with a general trending concept.
That means you can see the chart illustrating the company’s search volume changes over time, demographic distribution, and related queries.
But you won’t find details like the number of employees, the latest round, or total funding like you can with Exploding Topics.
You can still work around these limitations by performing your research manually, but it’s a bit more work, especially when you want to quickly scan through a huge list of startups.
So Treendly isn’t exactly an ideal tool for startup trend discovery, but it covers the basics well enough by tracking a good number of rising companies for you to consider.
Functional Macro Trend and Collections
Treendly has a new feature labeled “Collections” which is very similar to Exploding Topics Meta Trends library.
Essentially, this report curates broad trends and the micro-niche trends driving these larger patterns.
The tool gives you a big list of such macro trends.
You can use the filters to narrow down your search to macro trends occurring in specific categories only.
Inside each macro trend, you’ll see a chart illustrating the micro trends shaping up the big trend. In addition, the summary helps fill you in about the trend.
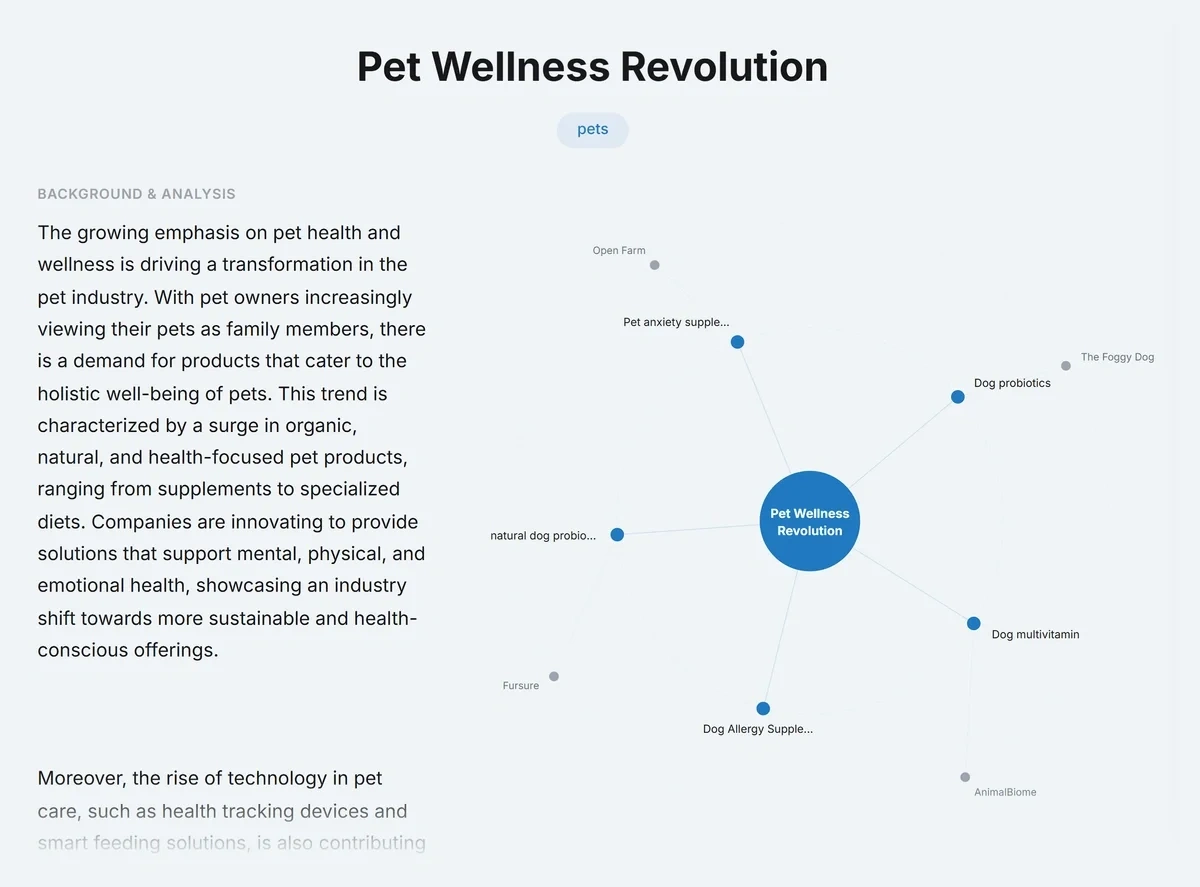
Just like Exploding Topics, you can click any micro trend to instantly open a menu revealing its chart, current search volume, and a basic summary.
I think Treendly is on the right track with these new features, even if they’re not completely original.
Understanding the relationship between macro and small trends is important for your marketing efforts. You can even use these ideas to create a cluster of related content aimed at enhancing your core topical authority.
API and MCP
Treendly has a handy API that you can use to pipe data into your own workflows and internal dashboards.
It’s great for looking up search terms and pulling their trend data. The API supports data analysis time ranges between 1 and 5 years.
That said, you’re only limited to performing term lookups with the API. So if you need to retrieve a list of topics matching a specific set of parameters, Treendly doesn’t yet support such API requests.
Exploding Topics API offers endpoints for retrieving topics, products, and companies separately, each with various parameters to ensure you’re only gathering the data you need.
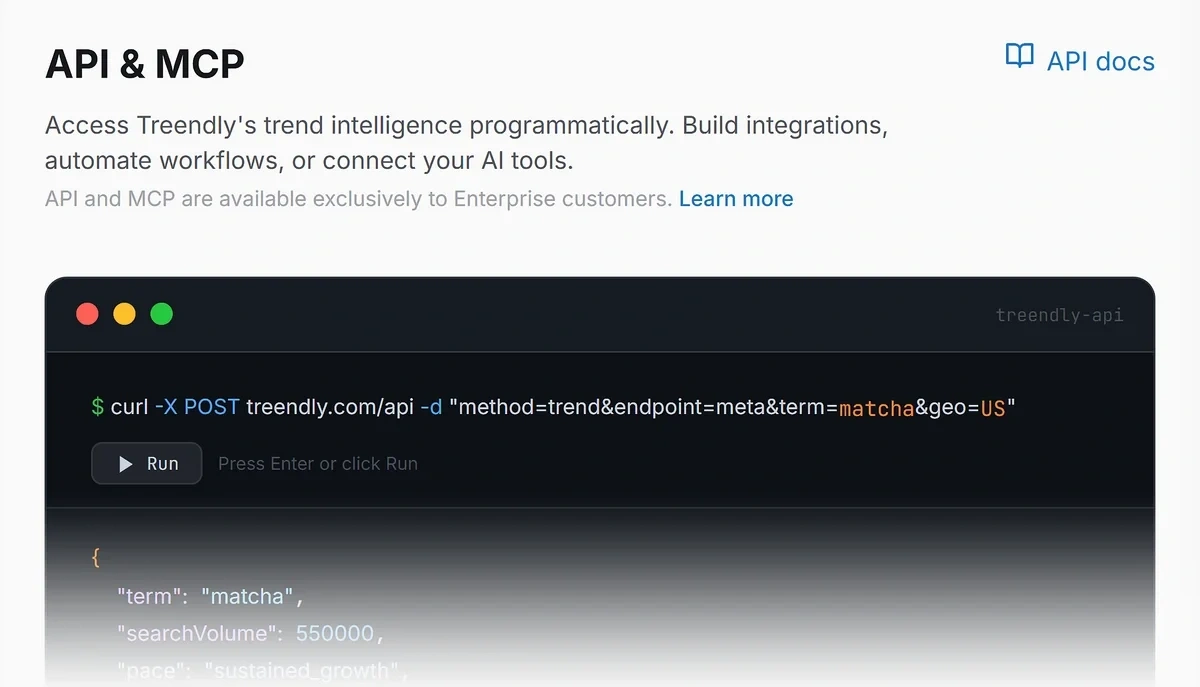
I like that Treendly has an MCP with various useful tools and actions.
Currently, you can use the MCP to retrieve trend data for a search term and get other details like charts and the speed of a trend’s growth.
It lets you browse curated trend lists.
So if you want your AI tool to suggest trends from a specific category or share certain highly specific themes, using the MCP as your data source can bring you accurate data inside your AI platform.
There’s even a tool for generating autocomplete suggestions from Google, Amazon, and YouTube.
This can be a great addition to your keyword and topic research process, and even for product ideation from Amazon.
It’s good to see Treendly adding actionable extra features like these that meaningfully expand the tool’s utility outside the main website.
General Usability and Interface Design
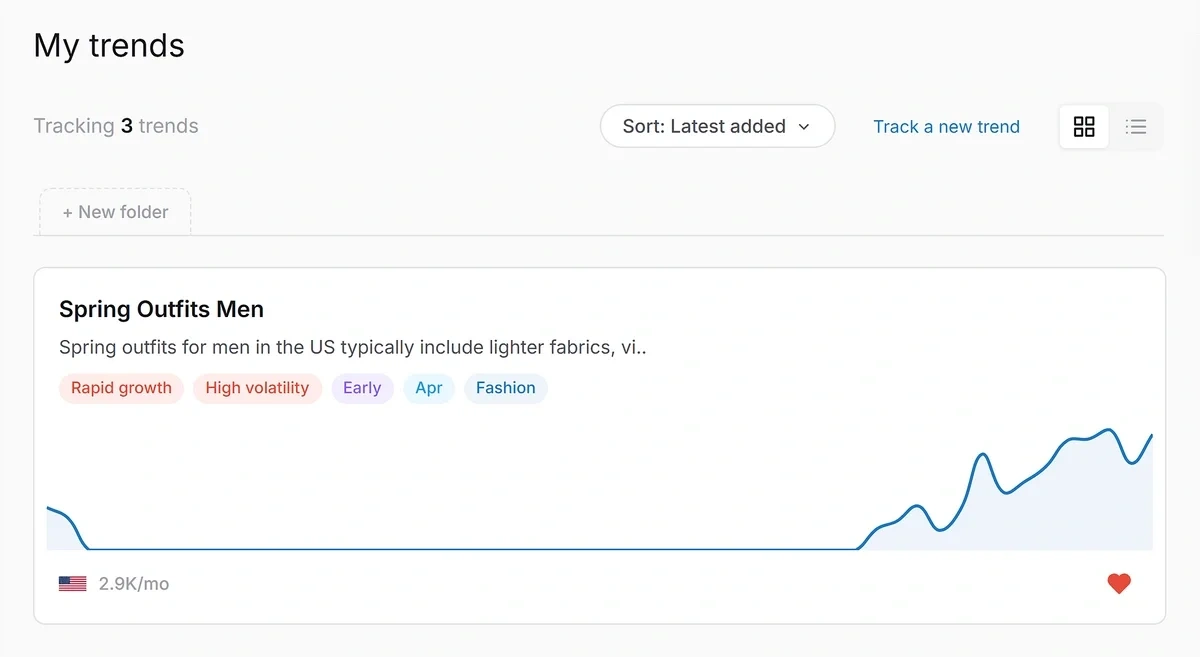
Treendly has a clean, uncluttered design that’s very intuitive to use.
There’s no learning curve to using the tool. All features are pretty self-explanatory.
Visually, the interface is spacious with trends organized into individual cards, similar to Exploding Topics.
The charts are easy to read, and navigation through the tool is straightforward.
That said, every page in Treendly takes a long time to load. I consistently had to wait a good few seconds every time I clicked open a new report before it loaded up.
So it can be a bit frustrating when you’re exploring different topics one by one because the tool takes its time to respond.
A snappier tool would make the general usability experience more satisfying. Barring that, I was impressed with Treendly’s overall interface design.
Affordable Price Point
Treendly offers two paid plans: Pro and Enterprise.
The Pro plan is priced at $99 per year. You can explore the full trend library with this plan and also monitor up to 25 trends in your dashboard.
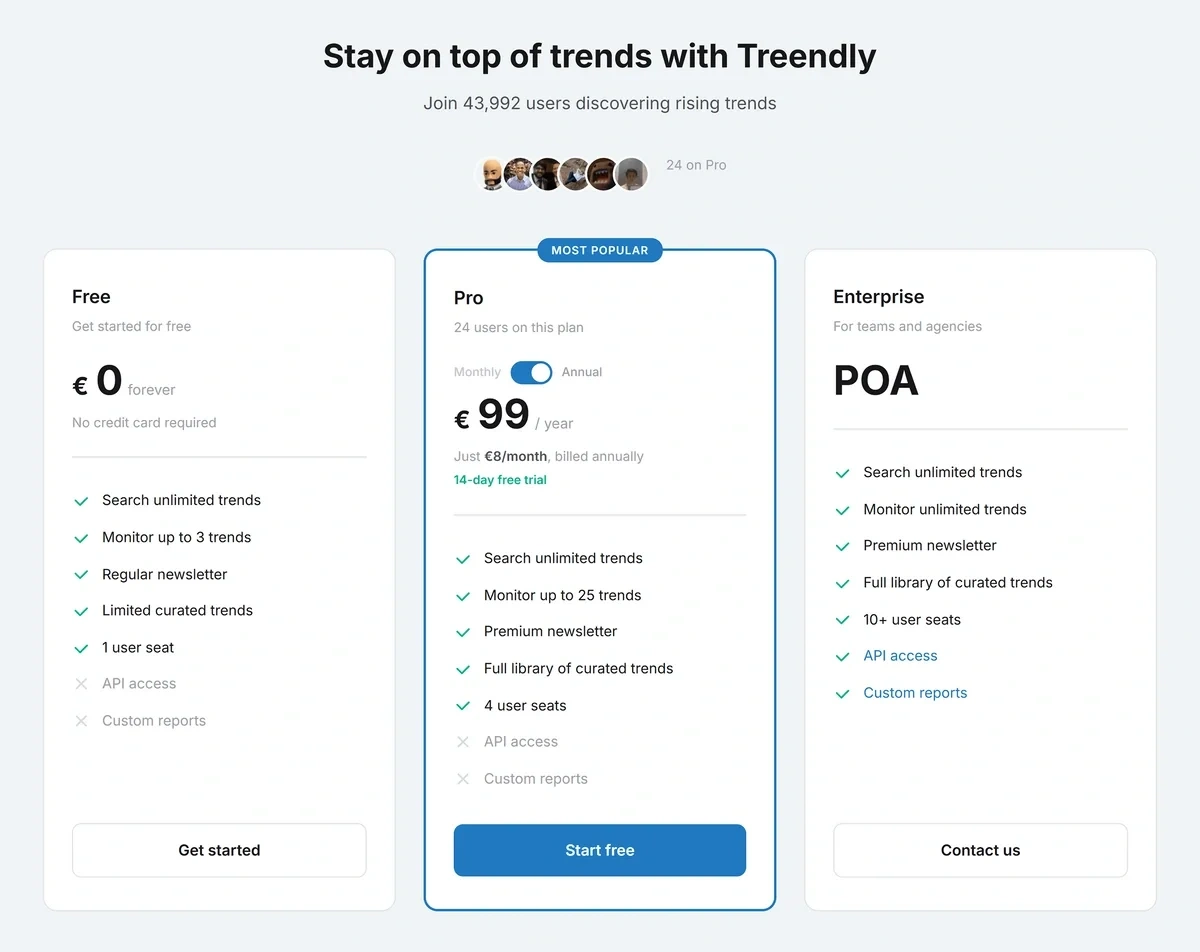
The Enterprise plan adds API access, custom reports, and unlimited trend tracking.
There’s no fixed pricing for the Enterprise plan; you’ll have to get a quote customized for your requirements.
Explore Trending Opportunities for Your Business Now
Treendly is a good tool for spotting important trends and analyzing the growth trajectory of topics you’re interested in.
It covers all the bases fairly well. You have a reasonably sized database for concepts, products, and startups.
Marketers, e-commerce businesses, and investors can all find a lot of value using Treendly for topic research, product research, and investment opportunities.
While Treendly is great, I don’t think it’s the best trend analysis tool on the market.
It lacks more advanced features like detailed product-related metrics and stats that go beyond just a trend’s search volume and the integration of TikTok data to discover socially validated product ideas.
The API is also a lot more restricted, with lower search history data and fewer parameters for retrieving precise trends.
So Exploding Topics is a superior alternative for more advanced use cases.
But if you’re a small business mainly interested in discovering new trends and measuring topic search volume, you can’t go wrong with Treendly.
Stop Guessing, Start Growing 🚀
Use real-time topic data to create content that resonates and brings results.
Exploding Topics is owned by Semrush. Our mission is to provide accurate data and expert insights on emerging trends. Unless otherwise noted, this page’s content was written by either an employee or a paid contractor of Semrush Inc.
Share
Newsletter Signup
By clicking “Subscribe” you agree to Semrush Privacy Policy and consent to Semrush using your contact data for newsletter purposes
Written By


Osama is an experienced writer and SEO strategist at Exploding Topics. He brings over 8 years of digital marketing experience, spe... Read more