Exploding Topics
Remineralizing Gum search volume grew from under 100 to 27,100 monthly searches between February 2024 and January 2026.
Remineralizing gum
+5100%
GLP 1 Supplement search volume grew from 5,920 to 74,000 monthly searches between February 2024 and January 2026.
GLP 1 supplement
+1150%
Soursop Bitters search volume grew from 9,900 to 110,000 monthly searches between March 2024 and February 2026.
Soursop bitters
+1011%



Get Advanced Insights on Any Topic
Discover Trends 12+ Months Before Everyone Else
How We Find Trends Before They Take Off
Exploding Topics’ advanced algorithm monitors millions of unstructured data points to spot trends early on.
Keyword Research
Performance Tracking
Competitor Intelligence
Fix Your Site’s SEO Issues in 30 Seconds
Find technical issues blocking search visibility. Get prioritized, actionable fixes in seconds.
Powered by data from
Latest Blog Posts
Featured Case Studies
See what's trending before everyone else
Each week, we'll send you our best Exploding Topics. Plus, expert insight and analysis.
E-commerce Conversion Rate Benchmarks by Industry (November 2026)

 Add Exploding Topics on GoogleAdd Exploding Topics as your preferred source to see more of our stories on Google.
The average e-commerce conversion rate is 2.68% based on benchmarks for October 2025 to September 2026.
For Shopify stores, the median conversion rate is 1.4% of sessions.
The top 20% of Shopify stores have a conversion rate above 2.7%.
But conversion rates vary a lot by industry. Beauty brands, in particular, enjoy significantly higher rates, converting almost 8 times as often as luxury and jewelry brands.
In this article, we'll break down e-commerce conversion rates by industry, device, and region, plus add-to-cart and cart abandonment benchmarks, and what the data says about improving your own rate.
Top E-commerce Conversion Rate Statistics
- The average e-commerce conversion rate is 2.68% of visitors
- The median Shopify store converts 1.4% of sessions, and the top 20% convert more than 2.7%
- Beauty and personal care has the highest average conversion rate, at 5.38%
- Luxury and jewelry has the lowest average conversion rate, at 0.69%
- Traffic from AI assistants converted 60% better than other traffic to US retail sites in July 2026
- The average documented cart abandonment rate is 70.22%
- Searches for "conversion rate optimization" grew 340% between October 2024 and September 2026.
What Is the Average E-commerce Conversion Rate?
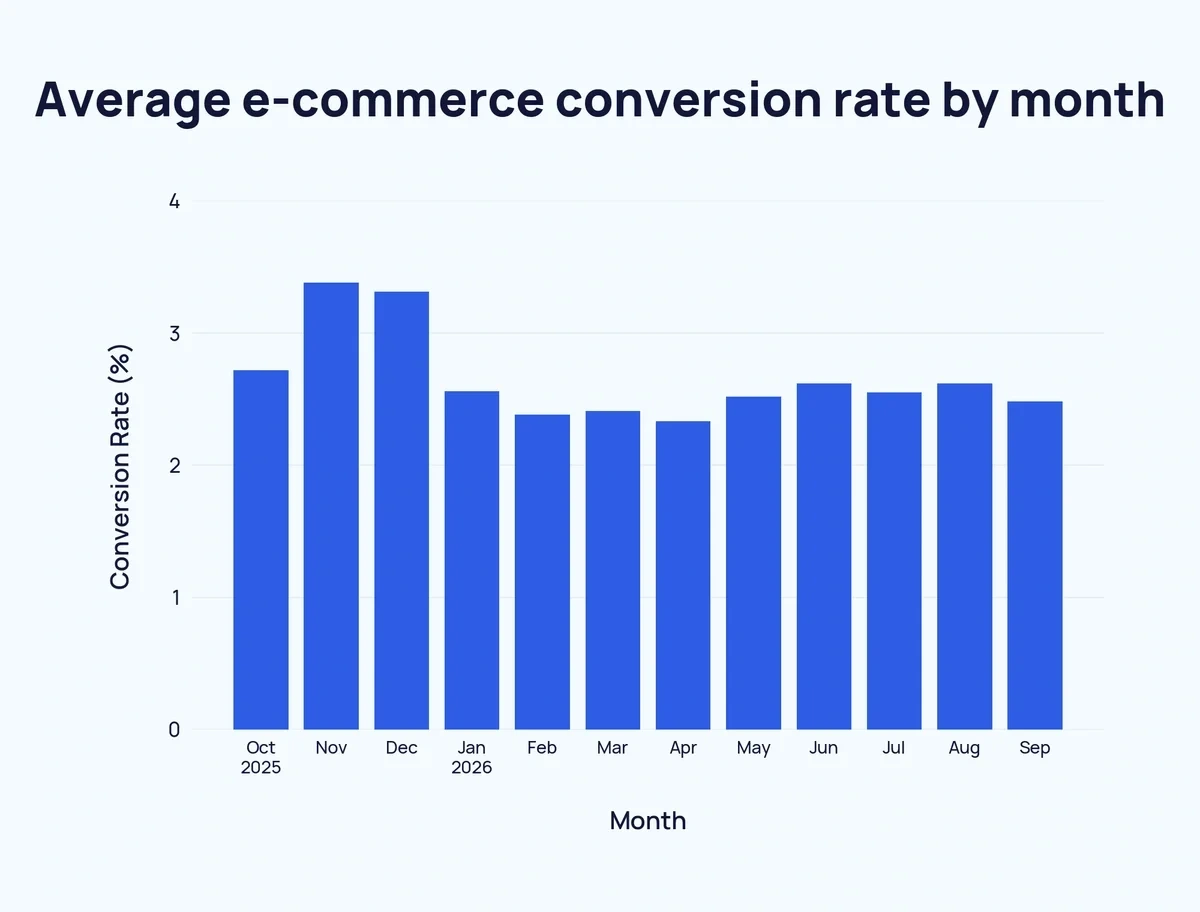
The average e-commerce conversion rate is 2.68%, based on purchases per visitor between October 2025 and September 2026.
However, Shopify stores recorded a lower figure when measured by sessions, with the median conversion rate at 1.4% of sessions.
Here's a breakdown of the latest e-commerce conversion rate benchmarks:
| Benchmark | Conversion Rate | What It Measures | Period | Source |
| Global average | 2.68% | Purchases per visitor, mostly large brands | October 2025 to September 2026 | Dynamic Yield |
| Shopify stores (median) | 1.4% | Sessions with an order, 426 Shopify stores | July to October 2026 | Littledata |
| Shopify stores (mean) | 1.9% | Sessions with an order, 426 Shopify stores | July to October 2026 | Littledata |
| UK and Ireland | 2.23% | Transactions per session | August 2026 | IRP Commerce |
The benchmarks differ partly because they measure different things. Dynamic Yield counts purchases per visitor, while Littledata counts orders per session, and one visitor can have several sessions.
Littledata's median is also lower than its 1.9% mean, because a few stores convert far above the rest.
Conversion rates also display seasonal variations. The average e-commerce conversion rate peaked at 3.38% in November 2025 and fell to 2.33% in April 2026.
This seasonality makes sense. Holidays and discounts drive buying momentum far higher than on typical days. The result is an overall uplift in conversion rates across industries sensitive to seasonal consumerism.
As a store owner, the important takeaway is to compare like-for-like. Use a benchmark that uses the same measure you also use to track conversion rates, and look at month-wise data breakdowns to gauge exactly where you stand in relation to your industry benchmarks.
What Is a Good E-commerce Conversion Rate?
Considering that the average e-commerce conversion rate is 2.68%, anything above that level is a good conversion rate.
The top 20% of Shopify stores convert at 2.7%, so this is a good figure to target for your store.
A conversion rate above 3.5% puts a store in the top 10%.
It could be an unrealistic target for most stores since this is an exception that only a few stores are able to reach.
Here's a breakdown of Shopify store conversion rates by ranking, based on Littledata's benchmark of 426 stores:
| Shopify Store Ranking | Conversion Rate |
| Top 10% | Above 3.5% |
| Top 20% | Above 2.7% |
| Median | 1.4% |
| Bottom 20% | Below 0.5% |
Some older guides say the top 20% of Shopify stores convert above 3.2% and the top 10% above 4.7%. Those figures came from an earlier version of Littledata's benchmark, which now shows 2.7% and 3.5%.
For more on how Shopify stores perform, see our Shopify statistics.
What Is the E-commerce Conversion Rate by Industry?
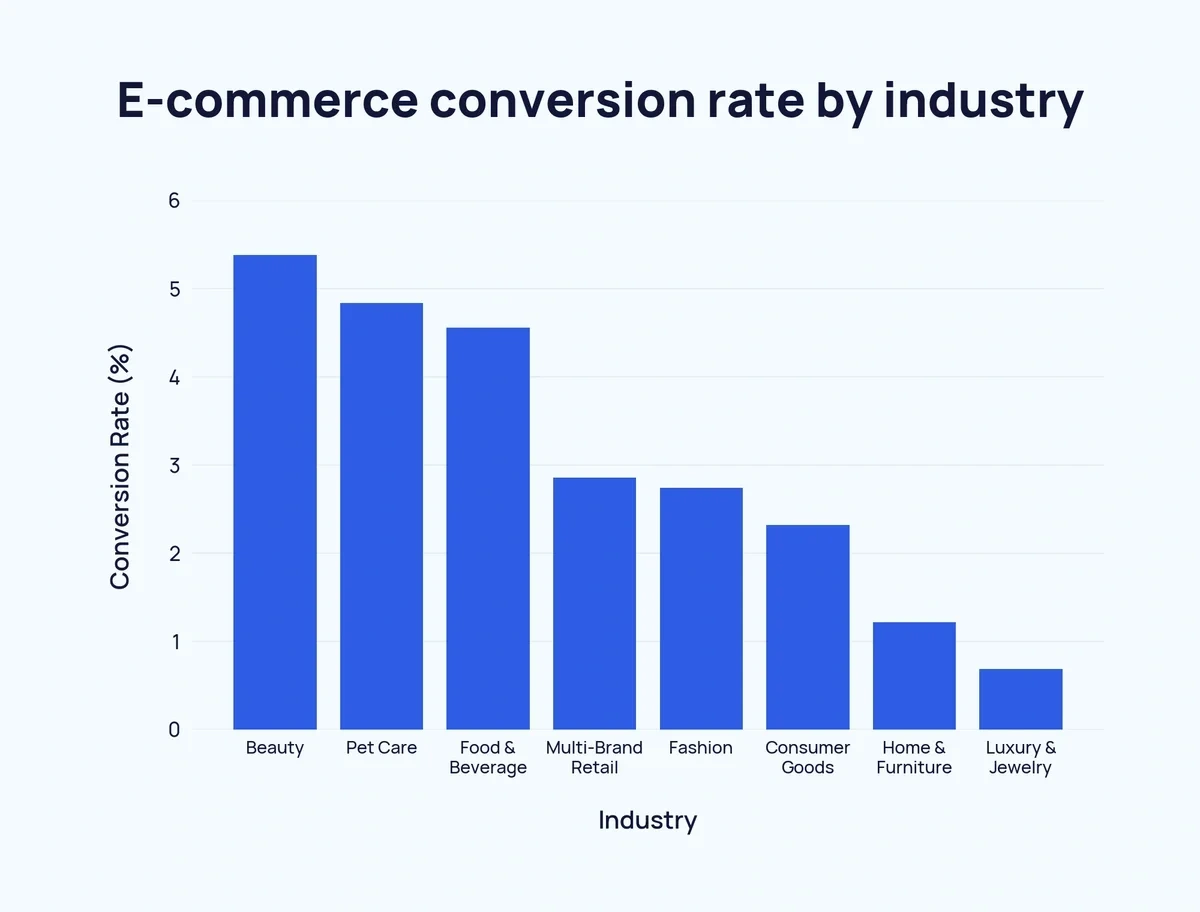
Beauty and personal care has the highest e-commerce conversion rate, at 5.38%. Luxury and jewelry has the lowest, at 0.69%.
Here's a breakdown of e-commerce conversion rates by industry:
| Industry | Average Conversion Rate (Dynamic Yield) | Median Shopify Conversion Rate (Littledata) |
| Beauty and personal care | 5.38% | 2.8% |
| Pet care | 4.84% | Not reported |
| Food and beverage | 4.56% | 2.3% |
| Health and supplements | Not reported | 2.5% |
| Multi-brand retail | 2.86% | Not reported |
| Fashion and apparel | 2.74% | 1.3% |
| Consumer goods | 2.32% | Not reported |
| Home and furniture | 1.22% | 0.9% |
| Luxury and jewelry | 0.69% | Not reported |
Both benchmarks put beauty and food near the top and home and furniture near the bottom. Littledata's Shopify medians are lower across the board, at 2.8% for beauty and 0.9% for home and furniture.
In Dynamic Yield's data, lower-priced categories such as beauty and food convert more often than big-ticket categories such as luxury and furniture.
The data shows that store owners selling furniture or jewelry at a conversion rate below 1% may still be normal for their industry. Perhaps even better than average.
What Is the E-commerce Conversion Rate by Device?
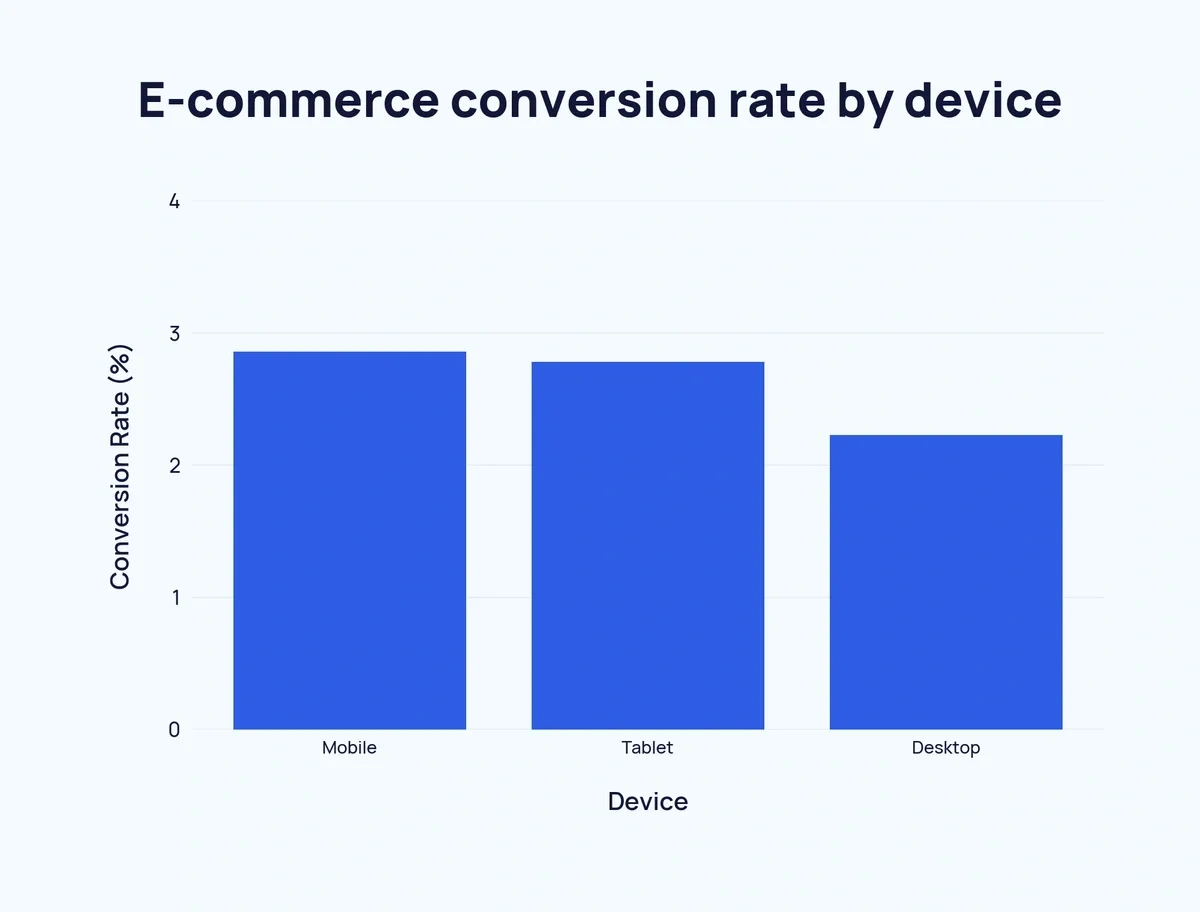
Mobile has the highest average e-commerce conversion rate, at 2.86%, compared with 2.78% for tablet and 2.23% for desktop. Mobile also made up 76% of e-commerce traffic in September 2026.
Here's a breakdown of e-commerce conversion rates by device, with each device's share of traffic from Dynamic Yield's device usage data:
| Device | Average Conversion Rate (Dynamic Yield) | Share of Traffic (Dynamic Yield, September 2026) | Median Shopify Conversion Rate (Littledata) |
| Mobile | 2.86% | 76% | 1.5% |
| Tablet | 2.78% | 1% | Not reported |
| Desktop | 2.23% | 23% | 1.5% |
Not every dataset agrees. Littledata found that the median Shopify store converts 1.5% on both mobile and desktop.
Mobile shoppers are also less likely to add to cart. The median Shopify add-to-cart rate is 5.4% on mobile, against 9.9% on desktop, according to Littledata.
Mobile also drives most holiday spending.
Smartphones accounted for 56.4% of US online spending in the 2025 holiday season.
These stats should make a fast, simple mobile checkout an action of the highest priority for online sellers.
E-commerce Conversion Rate by Region
Europe, the Middle East and Africa have the highest average e-commerce conversion rate, at 2.84%. The Americas average 2.59%, and Asia-Pacific 1.46%.
Here's a breakdown of e-commerce conversion rates by region, for October 2025 to September 2026:
| Region | Average Conversion Rate |
| Europe, Middle East and Africa | 2.84% |
| Americas | 2.59% |
| Asia-Pacific | 1.46% |
According to IRP Commerce, in the UK and Ireland, the e-commerce conversion rate rose from 1.85% in August 2025 to 2.23% in August 2026.
How Does AI Traffic Convert for E-commerce Stores?
Traffic from AI assistants converted 60% better than other traffic to US retail sites in July 2026. In March 2025, AI traffic converted worse than other traffic.
AI traffic converted 38% worse than other traffic in March 2025, then 42% better in March 2026.
By July 2026, AI-referred visits converted 60% better, and revenue per visit was 53% higher.
Here's a breakdown of how AI traffic to US retail sites has converted compared with other traffic:
| Month | AI Traffic Conversion Compared With Other Traffic |
| March 2025 | 38% lower |
| March 2026 | 42% higher |
| July 2026 | 60% higher |
Salesforce found the same pattern globally.
Shoppers who arrived from AI search converted 9 times as often as shoppers from social media during the 2025 holiday season.
AI traffic is still small, though. Contentsquare reports that AI traffic made up just 0.2% of website total traffic in Q4 2025.
Nonetheless, AI is shaking up pretty much every marketing channel and growing its contribution to brand visibility online.
As such, it's worth checking how your products appear in AI answers.
Our guide to optimizing an e-commerce store for AI search is a good starting point. And for the latest on AI checkout tools, see AI shopping and agentic commerce.
What Are the Add-to-Cart and Cart Abandonment Rate Benchmarks?
The average add-to-cart rate is 6.04%.
The average documented cart abandonment rate is 70.22%, according to Baymard Institute. Live platform data puts cart abandonment higher, at 77% to 82%.
Here's a breakdown of add-to-cart and cart abandonment rate benchmarks:
| Benchmark | Rate | Period | Source |
| Add-to-cart rate (global average) | 6.04% | October 2025 to September 2026 | Dynamic Yield |
| Add-to-cart rate (Shopify median) | 6.8% | July to October 2026 | Littledata |
| Cart abandonment rate (average of 50 studies) | 70.22% | Updated September 2025 | Baymard Institute |
| Cart abandonment rate (global average) | 77.38% | October 2025 to September 2026 | Dynamic Yield |
| Cart abandonment rate (Shopify median) | 79% | July to October 2026 | Littledata |
| Cart abandonment rate (global) | 82% | Q2 2026 | Salesforce |
Baymard's 70.22% is an average of 50 cart abandonment studies. The higher figures come from platforms that measure live store data.
A good add-to-cart rate for a Shopify store is above 12%, which puts a store in the top 20%.
Why Do Shoppers Abandon Their Carts?
Shoppers commonly abandon an online checkout when they see extra costs tacked on at the end, driving the prices higher than what they expected.
40% of US shoppers who abandoned a cart did so because shipping, tax, or fees were too high. That figure excludes shoppers who were just browsing.
Here are the top reasons US shoppers abandon an online checkout:
| Reason for Abandoning Checkout | Share of US Shoppers Who Abandoned (Excluding Just Browsing) |
| Extra costs too high (shipping, tax, fees) | 40% |
| Delivery too slow | 20% |
| Didn't trust the site with card details | 19% |
| Site wanted me to create an account | 18% |
| Too long or complicated checkout | 17% |
| Website errors or crashes | 17% |
Baymard estimates that a large e-commerce site could increase its conversion rate by 35.26% simply by improving its checkout design.
One strategy is to add guest checkouts, allowing customers to shop without having to sign up first. Showing the total estimated costs early is another way to set the right expectations and minimize abandonment.
Want to Spy on Your Competition?
Explore competitors’ website traffic stats, discover growth points, and expand your market share.
What Does Search Data Say About Conversion Rate Optimization?
Exploding Topics data shows that searches for "conversion rate optimization" grew 340% between October 2024 and September 2026. Searches reached 8.1K a month in September 2026, up from 6.9K a year earlier.
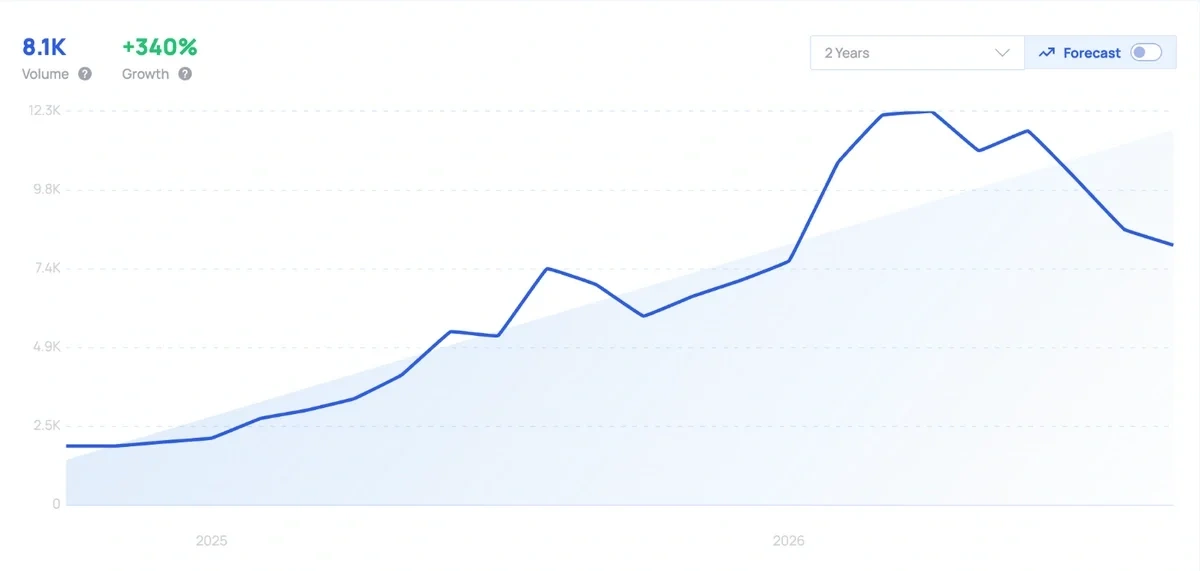
Additionally, searches for "AI shopping assistant" grew from 263 a month in October 2024 to 3.6K in September 2026.
Here's how monthly search interest in conversion-related topics has changed, according to Exploding Topics data:
| Search Term | October 2024 | September 2025 | September 2026 | 2-Year Change |
| Conversion rate optimization | 1.8K | 6.9K | 8.1K | +340% |
| AI shopping assistant | 263 | 6K | 3.6K | +1,269% |
| Shoppable video | 720 | 2.9K | 3.6K | +400% |
| A/B testing | 20.3K | 30.7K | 27.1K | +33% |
Rising interest in shoppable video and AI shopping assistants shows where shoppers and retailers are paying attention. Exploding Topics helps e-commerce brands spot product and marketing trends early.
Case study: How TribeTokes Grows Without Ads Using Exploding Topics
Cannabis brands can't use most forms of paid advertising, so TribeTokes relies on organic search and turns new website visitors into email subscribers.
CEO Degelis Pilla uses Semrush and Exploding Topics to find niche keywords that are easier to rank for. When THCV appeared in Exploding Topics, the team moved its THCV gummy up the release calendar.
How Can You Improve Your E-commerce Conversion Rate?
The data points to a few changes that can improve an e-commerce conversion rate: clearer costs, a simpler checkout, a better mobile experience, and automated email.
- Show total costs early: Extra costs are the top reason for abandoning checkout, at 40%.
- Offer guest checkout: 18% of US shoppers abandoned a checkout because they had to create an account
- Shorten the checkout: 17% abandoned because checkout was too long or complicated
- Design for mobile first: Mobile made up 76% of e-commerce traffic in September 2026
- Use automated email flows: Klaviyo found that automated flows have a 13 times higher placed order rate than one-off campaigns.
Klaviyo's figures come from its 2026 email marketing benchmarks. Flows also have more than 3 times the click rate of campaigns, at 5.58% against 1.69%.
It’s easy to get carried away and start applying new tactics at once to boost your conversion rate. But industry data and best practices don’t necessarily create the expected impact for every seller.
The safest approach is to change one thing at a time and A/B test it, so you can see what actually moves your conversion rate.
What's Next for E-commerce Conversion Rates?
The 2026 holiday season will be the next big test. Adobe expects US online sales to reach $275.1 billion in November and December 2026, up 6.7% year over year.
In addition, projections show 57.4% of holiday spending to happen on smartphones, and AI traffic to retail sites to rise 130% year over year.
Salesforce also predicts that 20% of 2026 holiday e-commerce traffic will come from AI chat agents, including shopping bots and price-scraping tools.
For more on how AI is changing holiday shopping, see our analysis of AI and Black Friday.
We'll update these benchmarks as new data comes out.
How We Compiled These Statistics
We used conversion rate, add-to-cart and cart abandonment benchmarks published by Dynamic Yield, Littledata, IRP Commerce and Baymard Institute, plus reports from Adobe Analytics, Salesforce, Contentsquare and Klaviyo.
Dynamic Yield's figures are 12-month averages for October 2025 to September 2026. Littledata's figures are medians for 426 Shopify stores, from July to October 2026. Where benchmarks use different measures, we say so. Search figures come from Exploding Topics. Figures are as of October 7, 2026.
For more e-commerce data, take a look at:
- E-commerce Statistics
- Online Shopping Statistics
- E-commerce Trends
- Number of Shopify Stores
- The Future of E-commerce
Benchmarks tell you where you stand, but your competitors tell you where you could be.
Use Exploding Topics Pro to spot fast-growing products before they peak. Combine that with Semrush Traffic Analytics to see how much traffic your competitors get, where it comes from, and how engaged their visitors are, so you know what you're up against.
Stop Guessing, Start Growing 🚀
Use real-time topic data to create content that resonates and brings results.
Exploding Topics is owned by Semrush. Our mission is to provide accurate data and expert insights on emerging trends. Unless otherwise noted, this page’s content was written by either an employee or a paid contractor of Semrush Inc.
Share
Newsletter Signup
By clicking “Subscribe” you agree to Semrush Privacy Policy and consent to Semrush using your contact data for newsletter purposes
Written By


Osama is an experienced writer and SEO strategist at Exploding Topics. He brings over 8 years of digital marketing experience, spe... Read more